Saturday, February 27, 2010

Configuring Dell switches

The following commands configure a Dell PowerConnect 8000 series switch (10.0.0.250), sampling packets at 1-in-512, polling counters every 30 seconds and sending sFlow to an analyzer (10.0.0.50) over UDP using the default sFlow port (6343):

sflow 1 destination 10.0.0.50 owner 1 timeout 4294967295
sflow 1 polling ethernet 1/g1-1/g10 30
sflow 1 sampling ethernet 1/g1-1/g10 512


A previous posting discussed the selection of sampling rates. Additional information can be found on the Dell web site.

See Trying out sFlow for suggestions on getting started with sFlow monitoring and reporting.

Tuesday, February 23, 2010

AMS-IX


An Internet Exchange (IX) is a specialized location where Internet Service Providers (ISPs) exchange traffic between their networks. Internet exchanges use high performance Ethernet switch fabrics to handle traffic volumes that far exceed anything seen in a typical corporate data center.

The Amsterdam Internet Exchange (AMS-IX) is one of the worlds largest Internet Exchanges (see List of Internet exchange points by size) with peak throughput exceeding 900Gbit/s. Providing network visibility in this environment requires a highly scalable measurement system.

The challenge facing AMX-IX is described in the paper,  sFlow: I can feel your traffic. "The explosion of internet traffic is leading to higher bandwidths and an increased need for high speed networks. To analyze and optimize such networks an efficient monitoring system is required." The paper goes on to describe their selection of sFlow as a measurement technology, "To give the AMS-IX members more insight into their peering traffic and provide information to optimize the network structure, AMS-IX is using sFlow for its traffic analysis."

The scalability of sFlow makes it a popular choice for traffic monitoring in Internet exchanges and in other high performance networking environments (see CERN). While most data center networks don't yet handle the traffic levels of an Internet exchange, virtualization and LAN/SAN convergence are dramatically increasing data center traffic.

Most switch vendors support the sFlow standard. Selecting a high-speed Ethernet switch fabric with sFlow offers a proven, scalable monitoring solution that delivers the data center visibility and control needed to manage costs and fully realize the benefits of virtualization.

Monday, February 15, 2010

Fog


The metaphor of the network as a "cloud" is appealing in its simplicity. The cloud abstraction imagines the network as a uniform communication medium in which location is no longer important. While a well provisioned and managed network can create this illusion, the reality is that networks are far from uniform and effective network visibility and control is required to maintain the illusion.

Using a cloud related metaphor to illustrate the importance of visibility; anyone who has driven in the fog knows how disorientating and dangerous a lack of visibility can be. Ignoring the need for visibility into network traffic in the data center risks turning the network cloud into a dense fog where the dynamic, efficient and flexible services promised by virtualization and cloud computing cannot be realized.

Network convergence to a single high-speed switched Ethernet fabric simplifies connectivity, while the sFlow standard implemented by most vendor's Ethernet switches, simplifies management by providing the network-wide visibility needed to manage network resources and deliver cloud services.

Monday, February 8, 2010

CERN


The CINBAD (CERN Investigation of Network Behavior and Anomaly Detection) project applies sFlow monitoring to the CERN IT infrastructure, "Even in CERN 'academic' environment, we can not afford network downtimes, especially when LHC starts to produce peta bytes of data."

Note: A previous posting looked at the use of sFlow within the Large Hadron Collider (LHC) to monitor the high speed Ethernet switches that form the control and data collection components the LHCb experiment.

The white paper, CINBAD keeps an eye on the CERN network, describes the CERN network, "CERN's campus network has more than 50,000 active user devices interconnected by 10,000 km of cables and fibres, with more than 2500 switches and routers. The potential 4.8 Tbps throughput within the network core and 140 Gbps connectivity to external networks offers countless possibilities to different network applications."

The paper goes on to describes the challenge of monitoring the CERN network, "To acquire knowledge about the network status and behaviour, CINBAD collects and analyses data from numerous sources. A naive approach might be to look at all of the packets flying over the CERN network. However, if we did this we would need to analyse even more data than the LHC could generate. The LHC data are only a subset of the total data crossing via these links."

Finally, the paper describes CERN's chosen solution "CINBAD overcomes this issue by applying statistical analysis and using sFlow, a technology for monitoring high-speed switched networks that provides randomly sampled packets from the network traffic."

While few organizations currently face the challenges of managing a network as large and complex as CERN's, many have plans to expand data centers, deploy converged networks, virtualization and cloud-based computing. Selecting network equipment that supports the sFlow standard delivers the scalable visibility and control needed to manage growth as new services are deployed.

Saturday, February 6, 2010

Scalability


The problem with networks, and many other types of system, is that as they get larger they also become more complex to manage. What makes the management challenge even harder is that complexity doesn't simply grow in proportion to network size, but tends to grow exponentially.


The reason for the exponential growth in complexity is that the various components of the system interact. The diagram above illustrates this effect with a very simple example. Imagine a network consisting of just two connected machines, A and B. The two possible interactions are A talks to B, or B talks to A.

Now consider the effect of adding two more machines, C and D. The additional interactions C talks to D and D talks to C doubles the complexity, however, A talks to C, C talk to A, B talk to D, D talks to B, A talks to D, D talks to A, B talks to C and C talk to B brings the total number of direct interactions to 12.

In this example, doubling the network size increased the number of possible interactions and the complexity by a factor of 6. For many systems this is an underestimate of the increase in complexity, we didn't take into account indirect interactions such as A talks to D via B etc.

To manage risk, many companies use small scale trials as a way to pilot new systems. However, while pilot implementations can be a useful way to test basic functionality, they do not guarantee that the solution will work when deployed at full scale. Many costly information system failures result because the challenge of managing large scale system complexity was not properly addressed (see Understanding Information System Failures from the Complexity Perspective).


Network-wide visibility provides a powerful means of reducing complexity. While network complexity results from the large number of possible interactions, only a tiny fraction of the possible interactions actually occur at an given moment. Traffic visibility reduces complexity by revealing the active paths so that resources can be applied where they are needed.

In order to be effective, the measurement system itself must be scalable, delivering the complete, timely, actionable information needed to manage complexity. The sFlow standard was designed specifically for scalable, network-wide visibility and control and enjoys broad multi-vendor support. Products incorporating the sFlow standard deliver visibility throughout the physical switch, virtual switch, virtual router and cloud layers, ensuring effective management of complexity in large, dynamic, virtualized environments.

Monday, February 1, 2010

Virtual routing


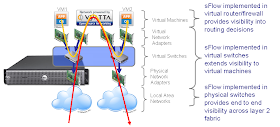
The diagram shows networking elements within a virtual server. The server's physical network adapters connect to LAN switches that provide a high speed, flat, layer 2, fabric connecting servers and storage in the data center. Virtual switches provide shared access to the physical adapters, connecting the virtual network adapters in the virtual machines to the physical network.

Current hierarchical network designs confine routing to specialized hardware at the core of the network.  It is worth re-examining the place of routing given the changes in data center architecture brought about by convergence and virtualization. What if routing could be virtualized?

The performance of software routers running on commodity x86 hardware is improving,  Vyatta recently announced 20 Gbps routing performance from their software routers. With network adapter support for virtualization (e.g. SR-IOV), it is now feasible to implement high-performance routing and firewall functionality in virtual machines.

Virtualization of routing offers a number of advantages:
  1. Virtualization allows services to be replicated and deployed where they are needed in the virtual infrastructure. A virtual router can easily be replicated to provide redundancy or add capacity.
  2. Virtual routing can provide better reliability and lower costs by making use of the general purpose virtual server infrastructure, eliminating the need for expensive, specialized router hardware.
  3. Distributing routing to the edge of the network reduces pressure on the core and improves scalability. 
There benefits don't just apply to routing, many other specialized devices can also be virtualized, including firewalls, load balancers, proxies etc. Virtualization of layer 3-7 network devices on a high performance converged Ethernet fabric offers a flexible and dynamic infrastructure that can easily be reconfigured to meet changing demands.

To illustrate the potential of virtualized networking, consider the example of a hosted data center. In a typical hosted data center, customers have racks or partial racks of equipment installed in the data center. A typical customer will have their own router, firewall, load balancer and servers installed in the rack. A virtual rack can be constructed by deploying routing and firewall virtual machines along with general purpose virtual machines that the customer can use to deploy their applications. A virtual rack can be provisioned and maintained automatically, providing customers with much more responsive service while reducing operating costs. In addition, virtualization allows higher customer densities per physical rack, increasing the revenue that can be generated per rack.

The benefits aren't restricted to service provider networks. In enterprise data centers, the flexibility of virtualized networking allows for more efficient management and utilization of resources. However, a barrier to realizing these benefits is the current siloed approach to data center management. Close coordination is needed between network and system management teams. For example, who would be responsible for provisioning and configuring a virtual router? This type of cross functional task is a challenge for most organizations.

Integrated traffic monitoring provides the visibility needed for effective management of virtualized networks. The diagram shows some of the data paths that are possible in a virtual stack: the red line shows traffic between two physical VLANs connected by a virtual router and the gold line shows traffic routed between two virtual machines hosted on the same server. In order to provide network visibility, every networking device, physical or virtual needs to include integrated traffic monitoring so that all traffic paths can be observed. Shared visibility into all resources in the data center ensures that each group (network, systems and storage) is aware of its impact on shared resources, eliminates finger pointing, improves coordination and lays the foundation for automating control.

There are many proprietary and standard technologies for embedded traffic monitoring. Broadly speaking these fall into two classes, TCP/IP flow monitoring built into many routers (e.g. Cisco NetFlow) and multi-protocol packet-based monitoring built into most switches. Convergence in both the LAN (data center bridging) and the WAN (Metro Ethernet and Carrier Ethernet) is taking place using Ethernet technologies, making the sFlow standard the logical choice for visibility since it enjoys broad, multi-vendor support and is already built into most vendor's Ethernet products. Just as convergence to Ethernet simplifies connectivity, convergence to sFlow standard monitoring built into Ethernet devices simplifies management of the converged network.

Products incorporating the sFlow standard provide visibility throughout the physical switch, virtual switchvirtual router and cloud layers, delivering the end to end visibility needed to realize the full benefits of virtualization and convergence.