Saturday, December 18, 2010

Visibility in the cloud


One of the challenges in moving a virtual machine from a private data center to a public cloud like Amazon Elastic Compute Cloud (EC2) or Rackspace Cloud is maintaining visibility into performance.

The article, Cloud-scale performance monitoring, describes how the sFlow standard delivers the visibility needed to manage the cloud infrastructure. In the case of a private cloud, where the physical infrastructure and virtual machines are dedicated to a single organization, the visibility provided by the infrastructure can be shared with internal customers and used to manage the services deployed in the cloud.

However, in a public cloud the infrastructure is owned and operated by the cloud service provider and customers are typically given very little visibility into the shared infrastructure hosting their virtual machines.

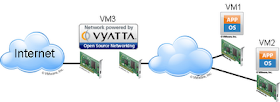
For example, the diagram at the top of this article shows three virtual machines, VM1, VM2 and VM3, hosted on two physical servers, Server 1 and Server 2. If these virtual machines were hosted in a private cloud all the elements of the physical and virtual infrastructure shown in the diagram can be instrumented with sFlow providing visibility to the management team.

However, move the three virtual machines to a public cloud and only the virtual machines are visible. A Management Boundary separates service provider resources from the customer resources and it is no longer possible to know which virtual machines are hosted on which physical servers or to see network and system performance using sFlow from switches and servers.


The diagram above shows the elements from the example that are visible in a public cloud deployment. The example is representative of a typical small scale deployment: the Vyatta virtual appliance (VM3) provides routing and firewall capabilities, VM1 is configured as a web server and VM2 as a database server. One of the benefits of moving to the public cloud is the ability to scale up the number of servers to meet demand. The article, How Zynga Survived FarmVille, describes using a public cloud provider to handle rapidly changing workloads. The architecture mentioned in the article is a widely adopted, scale-out, implementation of the elements shown in the diagram - see Memcached for additional details, large scale deployments of this architecture may involve thousands of servers.

In order to provide visibility in a public cloud deployment, each virtual machine must be responsible for monitoring its own performance. The Vyatta virtual appliance already includes support for sFlow. Installing Host sFlow agents on the virtual machines extends visibility to include network and system performance throughout the virtual machine cluster - see Cluster performance.

A key benefit of deploying services in the public cloud is the ability to dynamically add and remove capacity. In this environment, sFlow monitoring helps control costs by providing the data needed to closely match capacity to demand. In addition, many organizations operate hybrid clouds with some workloads running in a private cloud and others running in the public cloud. sFlow simplifies management by delivering integrated visibility across all the physical and virtual elements in the private and public cloud, providing the measurements needed to manage costs by striking the optimal balance between public and private cloud capacity.

Friday, December 17, 2010

ULOG

(Netfilter diagram from Wikimedia)

The Host sFlow agent recently added support for netfilter based traffic monitoring. The netfilter/iptables packet filtering framework is an integral part of recent Linux kernels, providing the mechanisms needed to implement firewalls and perform address translation.

Included within the netfilter framework is a packet sampling facility. In addition to sampling packets, the netfilter framework captures the forwarding path associated with each sampled packet, providing the essential elements needed to implement sFlow standard traffic monitoring on a Linux system.

Instructions for installing Host sFlow are provided in the article, Installing Host sFlow on a Linux server. In many cases configuring traffic monitoring on servers is unnecessary since sFlow capable physical and virtual switches already provide end-to-end network visibility (see Hybrid server monitoring). However, if traffic data isn't available from the switches, either because they don't support sFlow, or because they are managed by a different organization, then traffic monitoring on the servers is required.

This article describes the additional steps needed to configure sFlow traffic monitoring using netfilter. The following steps configure 1-in-1000 sampling of packets on a Fedora 14 server. The sampling rate of 1-in-1000 was selected based on the 1Gbit speed of the network adapter. See the article, Sampling rates, for suggested sampling rates.

First, list the existing iptables rules:

[root@fedora14 ~]# iptables --list --line-numbers --verbose
Chain INPUT (policy ACCEPT 0 packets, 0 bytes)
num   pkts bytes target     prot opt in     out     source               destination         
1        0     0 ACCEPT     all  --  lo     any     anywhere             anywhere            
2       93  8415 ACCEPT     all  --  any    any     anywhere             anywhere            state RELATED,ESTABLISHED 
3        1    84 ACCEPT     icmp --  any    any     anywhere             anywhere            
4        1    64 ACCEPT     tcp  --  any    any     anywhere             anywhere            state NEW tcp dpt:ssh 
5        9  1138 REJECT     all  --  any    any     anywhere             anywhere            reject-with icmp-host-prohibited 

Chain FORWARD (policy ACCEPT 0 packets, 0 bytes)
num   pkts bytes target     prot opt in     out     source               destination         
1        0     0 REJECT     all  --  any    any     anywhere             anywhere            reject-with icmp-host-prohibited 

Chain OUTPUT (policy ACCEPT 68 packets, 9509 bytes)
num   pkts bytes target     prot opt in     out     source               destination

Rules are evaluated in order, so it is important to find the correct place to apply sampling. The first rule in the INPUT chain accepts all traffic associated with the internal loopback interface (lo). This rule is needed because many applications use the loopback interface for inter-process communications. Since we are only interested in external traffic, the ULOG rule should be inserted as rule 2 in this rule chain:

iptables -I INPUT 2 -m statistic --mode random --probability 0.001 -j ULOG --ulog-nlgroup 5

There are currently no rules in the OUTPUT chain, so we can simply add the ULOG rule:

iptables -A OUTPUT -m statistic --mode random --probability 0.001 -j ULOG --ulog-nlgroup 5

Note: Sampling rates are expressed as probabilities, so the sampling rate of 1-in-1000 translates to a probability of 0.001. Only add one sFlow sampling rule to each chain. Duplicate sampling rules will result in biased measurements since the probability of sampling a packet will vary depending on where it matches in the chain. Use the same sampling probability in both INPUT and OUTPUT chains for the same reason.

Note: There are 32 netlink groups (1-32) that can be used to transmit ULOG messages. Check to see if there are any other ULOG statements in iptables and make sure to select a distinct group for sFlow sampling. In this case group 5 has been selected.

Listing the table again confirms that the changes are correct:

[root@fedora14 ~]# iptables --list
Chain INPUT (policy ACCEPT)
target     prot opt source               destination         
ACCEPT     all  --  anywhere             anywhere            
ULOG       all  --  anywhere             anywhere            statistic mode random probability 0.001000 ULOG copy_range 0 nlgroup 5 queue_threshold 1 
ACCEPT     all  --  anywhere             anywhere            state RELATED,ESTABLISHED 
ACCEPT     icmp --  anywhere             anywhere            
ACCEPT     tcp  --  anywhere             anywhere            state NEW tcp dpt:ssh 
REJECT     all  --  anywhere             anywhere            reject-with icmp-host-prohibited 

Chain FORWARD (policy ACCEPT)
target     prot opt source               destination         
REJECT     all  --  anywhere             anywhere            reject-with icmp-host-prohibited 

Chain OUTPUT (policy ACCEPT)
target     prot opt source               destination         
ULOG       all  --  anywhere             anywhere            statistic mode random probability 0.001000 ULOG copy_range 0 nlgroup 5 queue_threshold 1 

In many deployments, servers are running in a secure network behind a firewall and so the overhead of running a stateful firewall on each server is unnecessary. In this case a very simple, monitoring only, configuration of iptables provides traffic visibility with minimal impact on server performance:

[root@fedora14 ~]# iptables --list 
Chain INPUT (policy ACCEPT)
target     prot opt source               destination         
ULOG       all  --  anywhere             anywhere            statistic mode random probability 0.001000 ULOG copy_range 0 nlgroup 5 queue_threshold 1 

Chain FORWARD (policy ACCEPT)
target     prot opt source               destination         

Chain OUTPUT (policy ACCEPT)
target     prot opt source               destination         
ULOG       all  --  anywhere             anywhere            statistic mode random probability 0.001000 ULOG copy_range 0 nlgroup 5 queue_threshold 1 

Once the rules are correct, they should be saved so that they will automatically be reinstalled if the server is rebooted.

[root@fedora14 ~]# service iptables save

The Host sFlow agent needs to be configured to export the samples (by editing the /etc/hsflowd.conf file). The following configuration instructs the Host sFlow agent to use DNS-SD to automatically configure sFlow receivers and polling intervals. The additional ULOG settings tell the agent which ULOG nlgroup to listen to for packet samples as well as the sampling probability that was configured in iptables:

sflow {
  DNSSD = on

  # ULOG settings
  ulogProbability = 0.001
  ulogGroup = 5
}

Note: Make sure that the sampling probability specified in the Host sFlow configuration matches the probability used in the iptables rules. Any discrepancies will result in incorrectly scaled traffic measurements.

Next, restart the Host sFlow agent so that it picks up the new configuration:

[root@fedora14 ~]# service hsflowd restart

Note: The Host sFlow agent can resample ULOG captured packets in order to achieve the sampling rate specified using DNS-SD, or through the sampling setting in the /etc/hsflowd.conf file. Choose a relatively aggressive ULOG sampling probability that reduces the overhead of monitoring, but allows a wide range of sampling rates to be set. For example, configuring the ULOG probability to 0.01 will allow Host sFlow agent sampling rates to be set to 100, 200, 300, 400 etc. The Host sFlow agent will choose the nearest sampling rate it can achieve, so if you configure a sampling rate of 290, it would actually sample with a rate of 300 (i.e. sample every third ULOG packet).

At this point traffic data from the server should start appearing in the sFlow analyzer. The following chart shows top connections monitored using ULOG/Host sFlow:


Finally,  sFlow monitoring of servers is part of an overall solution that simplifies management by unifying network, storage, server and application performance monitoring within a single scalable system (see sFlow Host Structures). Implementing an sFlow monitoring solution helps break down management silos, ensuring the coordination of resources needed to manage a converged infrastructure.

Saturday, December 4, 2010

Baseline


Calculating a baseline is a common technique in network and system management. The article, SCOM: How self-tuning threshold baseline is computed, describes how a value is monitored over time allowing a statistical envelope of likely values to be calculated.  If the actual value falls outside the envelope then an alert is generated.

With any statistical baseline there is always a possibility that a normal value will fall outside the baseline envelope and trigger a false alarm. There is a tradeoff between making the baseline sensitive enough to quickly report an anomaly while avoiding excessive numbers of false alarms. For example, suppose that the value is monitored every minute. If the envelope covers 99.9% of values then between 1 and 2 false alarms per day would be expected. Reducing the sensitivity by choosing an envelope that covers 99.99% reduces the false positive rate to approximately 1 per week.

However, calculating a more accurate baseline is complicated by the need to monitor for a longer period. In the above example it would take at least a week to calculate the 99.99% baseline. Further complicating the calculation of longer term baselines is that the approach assumes a predictable and relatively static demand on the system. If demand is changing rapidly then the false alarm rate will go up since by the time the baseline is calculated it will no longer reflect the current behavior of the system.

The problem of false alarms creates a scalability problem when the time based, or temporal, baseline approach described above is used to monitor large numbers of items since the number of false alarms will increase as the number of items being monitored increases. For example, if there is only 1 false alarm per week per item being monitored, then the frequency of false alarms will go up with the number of items being monitored: going from 1 item to 1,000 items increases the false alarm rate to 1 every 10 minutes, increasing the number of items to 10,000 generates a false alarm every minute and finally, increasing the number of items to 100,000 generates a false alarm every 6 seconds.

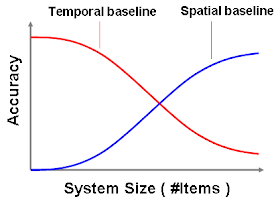
The following chart shows how the accuracy of temporal baseline declines with system size as the number of false alarms drowns out useful alerts.


An alternative approach to calculating baselines is shown on the graph. Instead of treating each item separately and comparing its current and past values, a spatial baseline compares items with each other and identifies items that differ from their peers. As a result, the accuracy of a spatial baseline increases as the number of items increases.

In addition, a spatial baseline requires no training period, allowing anomalies to be immediately identified. For example, when monitoring a converged data center environment a spatial baseline can be immediately applied as new resources added to a service pool whereas a temporal baseline approach would require time to calculate a baseline for the new member of the pool. In fact the addition of resources to the pool could cause a flurry of temporal baseline false alarms as the load profile of existing members of the resource pool changes, putting them outside their historic norms.


The table above compares performance metrics between servers within a cluster (see Top servers). It is immediately apparent from the chart that the server at the top of the chart has metrics that differ significantly from the other members of the 1,000 server cluster, indicating that the server is experiencing a performance anomaly.

To summarize, the following table compares temporal and spacial baseline techniques as they apply to small and large scale system monitoring:


The challenge in implementing a spatial baseline approach to anomaly detection is efficiently collecting metrics from all the systems in order to be able to compare them and create a baseline.

The sFlow standard is widely implemented by data center equipment vendors, providing an efficient solution that is ideally suited to managing performance in large scale converged, virtualized and cloud data center environments. The sFlow architecture provides a highly scalable mechanism for centrally collecting metrics from all the network, server and storage resources in the data center that is ideally suited to spatial baselining.

Wednesday, December 1, 2010

XCP 1.0 beta

This article describes the steps needed to configure sFlow monitoring on the latest Xen Cloud Platform (XCP) 1.0 beta release.

First, download and install the XCP 1.0 beta on a server. The simplest way to build an XCP server is to use the binaries from the XCP 1.0 beta download page.

Next, enable the Open vSwitch by opening a console and typing the following commands:

xe-switch-network-backend openvswitch
reboot

The article, Configuring Open vSwitch, describes the steps to manually configure sFlow monitoring. However, manual configuration is not recommended since additional configuration is required every time a bridge is added to the vSwitch, or the system is rebooted.

The Host sFlow agent automatically configures the Open vSwitch and provides additional performance information from the physical and virtual machines (see Cloud-scale performance monitoring).

Download the Host sFlow agent and install it on your server using the following commands:

rpm -Uvh hsflowd_XCP_xxx.rpm
service hsflowd start
service sflowovsd start

The following steps configure all the sFlow agents to sample packets at 1-in-512, poll counters every 20 seconds and send sFlow to an analyzer (10.0.0.50) over UDP using the default sFlow port (6343).

Note: A previous posting discussed the selection of sampling rates.

The default configuration method for sFlow is DNS-SD; enter the following DNS settings in the site DNS server:

analyzer A 10.0.0.50

_sflow._udp SRV 0 0 6343 analyzer
_sflow._udp TXT (
"txtvers=1"
"polling=20"
"sampling=512"
)

Note: These changes must be made to the DNS zone file corresponding to the search domain in the XCP server /etc/resolv.conf file. If you need to add a search domain to the DNS settings, do not edit the resolv.conf file directly since changes will be lost on a reboot, instead either follow the directions in How to Add a Permanent Search Domain Entry in the Resolv.conf File of a XenServer Host, or simply edit the DNSSD_domain setting in hsflowd.conf to specify the domain to use to retrieve DNS-SD settings.

Once the sFlow settings are added to the DNS server, they will be automatically picked up by the Host sFlow agents. If you need to change the sFlow settings, simply change them on the DNS server and the change will automatically be applied to all the XCP systems in the data center.

Manual configuration is an option if you do not want to use DNS-SD. Edit the Host sFlow agent configuration file, /etc/hsflowd.conf, on each XCP server:

sflow{
  DNSSD = off
  polling = 20
  sampling = 512
  collector{
    ip = 10.0.0.50
    udpport = 6343
  }
}

After editing the configuration file you will need to restart the Host sFlow agent:

service hsflowd restart

An sFlow Analyzer is needed to receive the sFlow data and report on performance (see Choosing an sFlow analyzer). The free sFlowTrend analyzer is a great way to get started, see sFlowTrend adds server performance monitoring to see examples.

March 3, 2011 Update: XCP 1.0 has now been released, download the production version from the XCP 1.0 Download page. The installation procedure hasn't changed - follow these instructions to enable sFlow on XCP 1.0.