The completed sFlow Host Structures specification has been published by sFlow.org, extending the sFlow standard to include physical and virtual server performance metrics. The specification describes a coherent framework that builds on the sFlow metrics exported by most switch vendors, linking network, server and application performance monitoring to provide an integrated picture of performance.
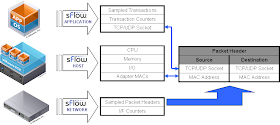
The diagram above shows how the packet header information exported by network devices is used to link network performance with performance metrics collected from servers and applications. The packet header contains MAC addresses corresponding to physical and virtual server network adapter cards as well as TCP/UDP socket information identifying individual application instances. Collecting sFlow data from the network devices provides an sFlow analyzer with a real-time map of the physical and logical relationships between entities on the network (see Packet paths and Application mapping).
A server exporting sFlow performance metrics includes an additional structure containing the MAC addresses associated with each of its network adapters. The inclusion of the MAC addresses provides a common key linking server performance metrics (CPU, Memory, I/O etc.) to network performance measurements (network flows, link utilizations, etc.), providing a complete picture of the server's performance (see Hybrid server monitoring and UUID)
The sFlow Host Structures specification builds on the scalable "counter push" mechanism that is used by network devices to export standard interface counters (see Link utilization). Most operating systems already maintain performance counter to track CPU, memory and I/O performance. The sFlow Host Structures specification leverages work done by the Ganglia project to define a common set of metrics across different operating systems, including: Windows, Linux (Fedora/RedHat/CentOS, Debian, Gentoo, SuSE/OpenSuSE), Solaris, FreeBSD, NetBSD, OpenBSD, DragonflyBSD and AIX. The extension of sFlow to include server performance metrics integrates network and system monitoring to deliver a data center wide view of performance (see Top servers and Cluster performance).
For virtual machine performance metrics, the sFlow Host Structures specification draws on definitions from the libvirt project which has defined a standard set of metrics that can be collected from a wide variety of virtualization platforms, including: Xen, QEMU, KVM, LXC, OpenVZ, User Mode Linux, VirtualBox, VMWare ESX and GSX. Again, the MAC addresses associated with each virtual machine are exported along with its performance metrics so that the virtual machine's performance can be linked to its network activity.
The sFlow Host Structures document also describes the extension of sFlow's sampling mechanism to include application transaction sampling. Examples of application level transactions include: HTTP requests to a web server, NFS/CIFS requests to a file server, memcached requests and operations performed by a Hadoop cluster. An application sFlow agent samples completed transactions, capturing information about each completed request, including: size, duration, type, URL, file name etc. Each application transaction sample is linked to the network through the inclusion of TCP/UDP socket information which can be matched to packet header information from network devices.
What clearly distinguishes sFlow from other monitoring technologies is the integrated, end-to-end, view of performance that it offers. Integration exponentially increases the value of information by making it actionable. For example, identifying that an application is running slowly isn't enough to solve the performance problem. However, if you also know that the server hosting the application is seeing poor disk performance, can link the disk performance to a slow NFS server, can identify the other clients of the NFS server and finally determine that all the request are competing for access to a single file, then you are in a position to take action. It is this ability to link data together, combined with the scalability to monitor every resource in the data center that makes sFlow revolutionary.


No comments:
Post a Comment