Thursday, October 28, 2010

Memcached missed keys


This article follows on from the sFlow for Memcached and Memcached hot keys articles and examines how sFlow can be used to improve the cache hit rate in a Memcached cluster.

In a typical Memcached deployment, a cache miss results in an expensive query to the database (see sFlow for Memcached). Since the database is usually the performance bottleneck, anything that can be done to reduce the number of misses can significantly boost the overall performance of the service. Memcached performance counters make it easy to calculate cache hit/miss rates and ratios, but don't provide insight into which keys are associated with misses. Keeping track of missed keys within Memcached would be prohibitively expensive since you would need to use memory to store information about the potentially infinite set of keys not in the cache, consuming memory that would be more usefully assigned to increase the cache size (and improve the cache hit rate).

When instrumented with sFlow, Memcached operations are sampled and the records are sent to a central location for analysis so there is no memory is taken away from the cache in order to identify top missed keys (see Superlinear for a more general discussion about the scalability of sFlow's architecture).

The article, Memcached hot keys contains a script that identifies the most frequently used keys in Memcached operations. The topkeys.pl script does not distinguish between operations and contains keys involved in hits and misses. Since sFlow reports the status code of each operation (see sFlow for memcached) it is straightforward to modify the topkeys.pl script to report only on misses (i.e. report on operations where memcached_status is NOT_FOUND=8).

The following Perl script, topmissedkeys.pl, runs sflowtool and processes the output to display the top 20 missed keys every minute:

#!/usr/bin/perl -w
use strict;
use POSIX;

sub min ($$) { $_[$_[0] > $_[1]] }
my $key_value = "";
my %key_count = ();
my $start = time();
open(PS, "/usr/local/bin/sflowtool|") || die "Failed: $!\n";
while( <PS> ) {
  my ($attr,$value) = split;
  if('memcache_op_key' eq $attr) {
    $value =~ s/\%([A-Fa-f0-9]{2})/pack('C', hex($1))/seg;
    $key_value = $value;
  }
  if('memcache_op_status' eq $attr) {
    if('8' eq $value) {
      $key_count{$key_value}++;
    }
  }
  if('endDatagram' eq $attr) {
    my $now = time();
    if($now - $start >= 60) {
      printf "=== %s ===\n", strftime('%m/%d/%Y %H:%M:%S', localtime);
      my @sorted = sort { $key_count {$b} <=> $key_count {$a}} keys %key_count;
      for(my $i = 0; $i < min(20,@sorted); $i++) {
        my $key = $sorted[$i];
        printf "%2d %3d %s\n", $i + 1, $key_count{$key}, $key;
      }
      %key_count = ();
      $start = $now;
    }
  }
}

close(PS);

The resulting output displays a sorted table of the top missed keys:

./topmissedkeys.pl
=== 10/27/2010 23:27:40 ===
 1   4 /tmp/hsperfdata_inmsf
 2   3 /tmp/hsperfdata_pp
 3   1 /etc/at.deny
 4   1 /etc/profile.d
 5   1 /etc/java
 6   1 /etc/gssapi_mech.conf
 7   1 /etc/cron.daily
 8   1 /etc/capi.conf
 9   1 /etc/passwd
10   1 /etc/gpm-root.conf
11   1 /etc/X11
12   1 /etc/hsflowd.conf
13   1 /etc/makedev.d
14   1 /etc/fonts
15   1 /etc/dovecot.conf
16   1 /etc/alchemist
17   1 /etc/yum.conf
18   1 /etc/printcap
19   1 /etc/smrsh
20   1 /etc/ld.so.cache

The table shows that the top missed key is /tmp/hsperfdata_inmsf, having occurred in 4 samples during the minute.

This example can be extended to display top clients, top operations, etc. associated with cache misses. In order to generate quantitatively accurate results, see Packet Sampling Basics, to see how to properly scale sFlow data.

Monday, October 25, 2010

Ganglia

The open source Ganglia Monitoring System is widely used to monitor high-performance computing systems such as clusters and Grids. The recent addition of sFlow support makes Ganglia an attractive option for monitoring servers in cloud computing environments (see Cloud-scale performance monitoring).


The diagram shows the elements of the solution. Each server sends sFlow to the Ganglia gmond process which builds an in-memory database containing the server statistics. The Ganglia gmetad process periodically queries the gmond database and updates trend charts that are made available through a web interface. The sFlow server performance data seamlessly integrates with Ganglia since the standard sFlow server metrics are based on Ganglia's core set of metrics (see sFlow Host Structures).

The Host sFlow agent is a free, open source sFlow implementation. The Host sFlow agent reports on the performance of physical and virtual servers and currently supports Linux and Windows servers as well as the XenServer, Xen/XCP, KVM and libvirt virtualization platforms.

Note: To try out Ganglia's sFlow reporting, you will need to download and compile Ganglia from sources since the feature is currently in the development branch (see http://sourceforge.net/projects/ganglia/develop).

The following entry in the gmond configuration file (/etc/gmond.conf) opens a port to receive sFlow data:

/* sFlow channel */
udp_recv_channel {
  port = 6343
}

The integration of network, system and application monitoring (see sFlow Host Structures) makes sFlow ideally suited for converged infrastructure monitoring. Using a single multi-vendor standard for both network and system performance monitoring reduces complexity and provides the integrated view of performance needed for effective management (see Management silos).

Jul. 7, 2011 Update: The latest Ganglia release now includes sFlow support, see Ganglia 3.2 released.

Thursday, October 21, 2010

Installing Host sFlow on a Linux server

The Host sFlow agent supports Linux performance monitoring, providing a lightweight, scalable solution for monitoring large numbers of Linux servers.

The following steps demonstrate how to install and configure the Host sFlow agent on a Linux server, sending sFlow to an analyzer with IP address 10.0.0.50.

Note: If there are any firewalls between the Linux servers and the sFlow analyzer, you will need to ensure that packets to the sFlow analyzer (UDP port 6343) are permitted.

First go to the Host sFlow web site and download the RPM file for your Linux distribution. If an RPM doesn't exist, you will need to download the source code.

If you are installing from RPM, the following commands will install and start the Host sFlow agent:

rpm -Uvh hsflowd_XXX.rpm
service hsflowd start

If you are building from sources, then using the following commands:

tar -xzf hsflowd-X.XX.tar.gz
cd hsflowd-X.XX
make
make install
make schedule
service hsflowd start

The default configuration method used for sFlow is DNS-SD; enter the following DNS settings in the site DNS server:

analyzer A 10.0.0.50

_sflow._udp SRV 0 0 6343 analyzer
_sflow._udp TXT (
"txtvers=1"
"polling=20"
"sampling=512"
)

Note: These changes must be made to the DNS zone file corresponding to the search domain in the Linux server's /etc/resolv.conf file. Alternatively, you can explicitly configure the domain using the DNSSD_domain setting in /etc/hsflowd.conf.

Once the sFlow settings are added to the DNS server, they will be automatically picked up by the Host sFlow agents. If you need to change the sFlow settings, simply change them on the DNS server and the change will automatically be applied to all the Linux systems in the data center.

Manual configuration is an option if you do not want to use DNS-SD. Edit the Host sFlow agent configuration file, /etc/hsflowd.conf, on each Linux server:

sflow{
  DNSSD = off
  polling = 20
  sampling = 512
  collector{
   ip = 10.0.0.50
   udpport = 6343
  }
}

After editing the configuration file you will need to restart the Host sFlow agent:

service hsflowd restart

For a complete sFlow monitoring solution you should also collect sFlow from the switches connecting the servers to the network (see Hybrid server monitoring). The sFlow standard is designed to seamlessly integrate monitoring of networks and servers (see sFlow Host Structures).

An sFlow analyzer is needed to receive the sFlow data and report on performance (see Choosing an sFlow analyzer). The free sFlowTrend analyzer is a great way to get started, see sFlowTrend adds server performance monitoring to see examples.

Update: The inclusion of iptables/ULOG support in the Host sFlow agent provides an efficient way to monitor detailed traffic flows if you can't monitor your top of rack switches or if you have virtual machines in a public cloud (see Amazon Elastic Compute Cloud (EC2) and Rackspace cloud servers).

Update: See Configuring Host sFlow for Linux via /etc/hsflowd.conf for the latest configuration information. The Host sFlow agent now supports Linux bridge, macvlan, ipvlan, adapters, Docker, and TCP round trip time.

Installing Host sFlow on a Windows server


The Host sFlow agent supports Windows performance monitoring, providing a lightweight, scalable solution for monitoring large numbers of Windows servers.

The following steps demonstrate how to install and configure the Host sFlow agent on a Windows server, sending sFlow to an analyzer with IP address 10.0.0.50.

Note: If there are any firewalls between the Windows servers and the sFlow analyzer, you will need to ensure that packets to the sFlow analyzer (UDP port 6343) are permitted.

First go to the Host sFlow web site, http://host-sflow.sourceforge.net


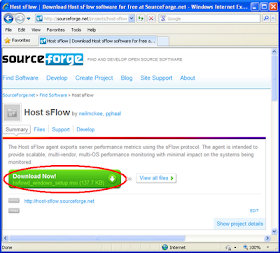
Click on the DOWNLOAD NOW button.


If you are using a browser on the Windows server, you should automatically be offered the file hsflowd_windows_setup.msi, click on the Download Now! button to download this file.

Note: If the Windows install file isn't displayed, click on the View all files button and select the file from the list.


Click on the Run button to install the software on your current server. Otherwise, click Save to store the file and copy it to the target system.


Click on the Run button to confirm that you want to install the software.


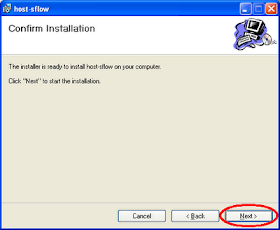
Click the Next> button


Confirm the installation location and click the Next> button


Enter the IP address of your sFlow analyzer, in this case 10.0.0.50, then click the Next> button.


Click on the Next> button to confirm that you want to install the software.


The Host sFlow agent is now installed, click the Close button to finish.

For a complete sFlow monitoring solution you should also collect sFlow from the switches connecting the servers to the network (see Hybrid server monitoring). The sFlow standard is designed to seamlessly integrate monitoring of networks and servers (see sFlow Host Structures).

An sFlow analyzer is needed to receive the sFlow data and report on performance (see Choosing an sFlow analyzer). The free sFlowTrend analyzer is a great way to get started, see sFlowTrend adds server performance monitoring to see examples.

Friday, October 15, 2010

KVM


Performance of the KVM (Kernel-based Virtual Machine) virtualization system can be monitored using sFlow through a combination of Host sFlow and Open vSwitch software (see Cloud-scale performance monitoring).

The Host sFlow agent provides visibility into the performance of the physical and virtual servers (see sFlow Host Structures). Download the Host sFlow agent and install it on your KVM server using the following commands:

rpm -Uvh hsflowd_KVM-XXX.rpm
service hsflowd start

Note: The virtual machine statistics exported by the Host sFlow agent are equivalent to statistics that can be obtained using the libvirt based tools (virsh, virt-manager) typically used in KVM environments (see libvirt). However, the Host sFlow agent also exports detailed statistics from the physical server as well as coordinating traffic measurements made by the vSwitch.

The Open vSwitch natively supports sFlow, providing visibility into network traffic. To include traffic monitoring, download the Open vSwitch and follow the instructions in How to Install Open vSwitch on Linux and How to Use Open vSwitch with KVM.

Note: There are many good reasons to use the Open vSwitch as your default switch. In addition to sFlow support, the Open vSwitch implements the OpenFlow protocol, providing distributed switching and network virtualization functionality.

The article, Configuring Open vSwitch, describes the steps to manually configure sFlow monitoring. However, manual configuration is not recommended since additional configuration is required every time a bridge is added to the vSwitch, or the system is rebooted. Instead, the Host sFlow agent can automatically configure the sFlow settings in the Open vSwitch, just run the following command to enable this feature:

service sflowovsd start

Note: While the Open vSwitch currently provides the best option for monitoring traffic between virtual machines, the combination of the Host sFlow agent and an sFlow capable switch offers a good alternative (see Hybrid server monitoring). The emerging IEEE 802.1Qbg Edge Virtual Bridging (EVB) standard will make it possible for the switch to monitor traffic between virtual machines (see VEPA).

The following steps configure all the sFlow agents to sample packets at 1-in-512, poll counters every 20 seconds and send sFlow to an analyzer (10.0.0.50) over UDP using the default sFlow port (6343).

Note: A previous posting discussed the selection of sampling rates.

The default configuration method used for sFlow is DNS-SD; enter the following DNS settings in the site DNS server:

analyzer A 10.0.0.50

_sflow._udp SRV 0 0 6343 analyzer
_sflow._udp TXT (
"txtvers=1"
"polling=20"
"sampling=512"
)

Note: These changes must be made to the DNS zone file corresponding to the search domain in the KVM server's /etc/resolv.conf file.

Once the sFlow settings are added to the DNS server, they will be automatically picked up by the Host sFlow agents. If you need to change the sFlow settings, simply change them on the DNS server and the change will automatically be applied to all the KVM systems in the data center.

Manual configuration is an option if you do not want to use DNS-SD. Edit the Host sFlow agent configuration file, /etc/hsflowd.conf, on each KVM server:

sflow{
  DNSSD = off
  polling = 20
  sampling = 512
  collector{
    ip = 10.0.0.50
    udpport = 6343
  }
}

After editing the configuration file you will need to restart the Host sFlow agent:

service hsflowd restart

An sFlow analyzer is needed to receive the sFlow data and report on performance (see Choosing an sFlow analyzer). The free sFlowTrend analyzer is a great way to get started, see sFlowTrend adds server performance monitoring to see examples.

libvirt

The open source libvirt project has created a common set of tools for managing virtualization resources on different virtualization platforms (currently Xen, QEMU, KVM, LXC, OpenVZ, User Mode Linux, VirtualBox and VMware ESX and GSX). An important element of libvirt is the definition of a standard set of metrics for monitoring performance of virtualization domains (virtual machines).

The sFlow standard includes the libvirt performance metrics (see sFlow Host Structures), providing consistency between different virtualization platforms and between sFlow and libvirt based performance monitoring systems.

The benefit of using sFlow for virtual machine performance monitoring is the improved scalability (see Cloud-scale performance monitoring) and the integration of virtualization metrics with network and system performance monitoring (see Management silos).

Friday, October 8, 2010

XCP 0.5

Xen.org mascot

A previous article talked about Xen Cloud Platform (XCP). The latest XCP 0.5 release includes the Open vSwitch, providing native support for sFlow monitoring of network traffic. This article will describe the steps needed to enable sFlow on the XCP 0.5 release.

First, download and install XCP 0.5 on a server. The simplest way to build an XCP server is use the Base ISO from the Xen Cloud Platform Source page.

The article, Configuring Open vSwitch, describes the steps to manually configure sFlow monitoring. However, manual configuration is not recommended since additional configuration is required every time a bridge is added to the vSwitch, or the system is rebooted.

The Host sFlow agent automatically configures the Open vSwitch and provides additional performance information from the physical and virtual machines (see Cloud-scale performance monitoring).

Download the Host sFlow agent and install it on your XCP server using the following commands:

rpm -Uvh hsflowd_XCP_05-XXX.rpm
service hsflowd start
service sflowovsd start

The following steps configure all the sFlow agents to sample packets at 1-in-512, poll counters every 20 seconds and send sFlow to an analyzer (10.0.0.50) over UDP using the default sFlow port (6343).

Note: A previous posting discussed the selection of sampling rates.

The default configuration method used for sFlow is DNS-SD; enter the following DNS settings in the site DNS server:

analyzer A 10.0.0.50

_sflow._udp SRV 0 0 6343 analyzer
_sflow._udp TXT (
"txtvers=1"
"polling=20"
"sampling=512"
)

Note: These changes must be made to the DNS zone file corresponding to the search domain in the XCP server's /etc/resolv.conf file.

Once the sFlow settings are added to the DNS server, they will be automatically picked up by the Host sFlow agents. If you need to change the sFlow settings, simply change them on the DNS server and the change will automatically be applied to all the XenServer systems in the data center.

Manual configuration is an option if you do not want to use DNS-SD. Edit the Host sFlow agent configuration file, /etc/hsflowd.conf, on each XCP server:

sflow{
  DNSSD = off
  polling = 20
  sampling = 512
  collector{
    ip = 10.0.0.50
    udpport = 6343
  }
}

After editing the configuration file you will need to restart the Host sFlow agent:

service hsflowd restart

An sFlow analyzer is needed to receive the sFlow data and report on performance (see Choosing an sFlow analyzer). The free sFlowTrend analyzer is a great way to get started, see sFlowTrend adds server performance monitoring to see examples.

Citrix XenServer


The Citrix XenServer server virtualization solution now includes support for the sFlow standard, delivering the lightweight, scalable performance monitoring solution needed to optimize workloads, isolate performance problems and charge for services. The sFlow standard is widely supported by data center switch vendors: using sFlow to monitor the virtual servers provides an integrated view of network and system performance and reduces costs by eliminating layers of monitoring (see Management silos).

This article describes the steps to enable sFlow in a XenServer environment. The latest XenServer release, XenServer 5.6 Feature Pack 1 (a.k.a. "Cowley"), includes the Open vSwitch and these instructions apply specifically to this release. If you are interested in enabling sFlow on an older version of XenServer, you will need to manually install the Open vSwitch (see How to Install Open vSwitch on Citrix XenServer).

First, enable the Open vSwitch by opening a console and typing the following commands:

xe-switch-network-backend openvswitch
reboot

Note: There are many good reasons to enable the Open vSwitch as your default switch. In addition to sFlow support, the Open vSwitch implements the OpenFlow protocol, providing distributed switching and network virtualization functionality (see The Citrix Blog: The Open vSwitch - Key Ingredient of Enterprise Ready Clouds).

The article, Configuring Open vSwitch, describes the steps to manually configure sFlow monitoring. However, manual configuration is not recommended since additional configuration is required every time a bridge is added to the vSwitch, or the system is rebooted.

The Host sFlow agent automatically configures the Open vSwitch and provides additional performance information from the physical and virtual machines (see Cloud-scale performance monitoring).

Download the Host sFlow agent and install it on your server using the following commands:

rpm -Uvh hsflowd_XenServer_56FP1-XXX.rpm
service hsflowd start
service sflowovsd start

The following steps configure all the sFlow agents to sample packets at 1-in-512, poll counters every 20 seconds and send sFlow to an analyzer (10.0.0.50) over UDP using the default sFlow port (6343).

Note: A previous posting discussed the selection of sampling rates.

The default configuration method used for sFlow is DNS-SD; enter the following DNS settings in the site DNS server:

analyzer A 10.0.0.50

_sflow._udp SRV 0 0 6343 analyzer
_sflow._udp TXT (
"txtvers=1"
"polling=20"
"sampling=512"
)

Note: These changes must be made to the DNS zone file corresponding to the search domain in the XenServer /etc/resolv.conf file. If you need to add a search domain to the DNS settings, do not edit the resolv.conf file directly since the changes will be lost on a system reboot, instead either follow the directions in How to Add a Permanent Search Domain Entry in the Resolv.conf File of a XenServer Host, or simply edit the DNSSD_domain setting in hsflowd.conf to specify the domain to use to retrieve DNS-SD settings.

Once the sFlow settings are added to the DNS server, they will be automatically picked up by the Host sFlow agents. If you need to change the sFlow settings, simply change them on the DNS server and the change will automatically be applied to all the XenServer systems in the data center.

Manual configuration is an option if you do not want to use DNS-SD. Edit the Host sFlow agent configuration file, /etc/hsflowd.conf, on each Xenserver:

sflow{
  DNSSD = off
  polling = 20
  sampling = 512
  collector{
    ip = 10.0.0.50
    udpport = 6343
  }
}

After editing the configuration file you will need to restart the Host sFlow agent:

service hsflowd restart

An sFlow analyzer is needed to receive the sFlow data and report on performance (see Choosing an sFlow analyzer). The free sFlowTrend analyzer is a great way to get started, see sFlowTrend adds server performance monitoring to see examples.

Feb. 23, 2011 Update: The Host sFlow agent is now available as a XenServer supplemental pack. For installation instructions see XenServer supplemental pack

sFlowTrend adds server performance monitoring


The latest release of the free sFlowTrend application adds support for sFlow Host Structures, integrating network and server monitoring in a single tool.

Note: The open source Host sFlow agent provides an easy way to add sFlow host monitoring to your servers (see Host sFlow 1.0 released).

The above screen capture shows the new sFlowTrend Host statistics tab which displays physical and virtual server summary statistics (see Top Servers). The relationship between physical and virtual hosts is clearly displayed, the virtual machines are show as nested within the physical host.

Clicking on a physical host brings up a detailed trend of performance on the physical host (see below):


Similarly, clicking on a virtual host displays virtual server statistics (see below):


However, visibility isn't limited to traditional server performance statistics. Since the sFlow standard is widely supported by switch vendors, we can also look at the network traffic associated with the hosts (see Hybrid server monitoring).

In this case we can even use sFlow to look inside a server and see the traffic between virtual machines since the hypervisor contains the Open vSwitch. The top connections through the virtual switch are shown below:


Have you every wondered what happens to the network traffic when you migrate a virtual machine? The following chart shows the spike in network traffic that occurs during a virtual machine migration (clearly something to be aware of when provisioning network capacity):


An integrated view of network and server performance is critical for managing servers, storage and networking in converged environments (see Convergence).

Download a copy of sFlowTrend to try out sFlow monitoring of your switches and servers.

Saturday, October 2, 2010

Memcached hot keys


This article follows on from sFlow for Memcached, describing how to analyze sFlow data from a Memcached cluster in order to determine the "hot keys".

Currently the only software that can decode sFlow from Memcached servers is sflowtool.  Download, compile and install the latest sflowtool sources on the system you are going to use to receive sFlow from the servers in the Memcached cluster.

Running sflowtool will display output of the form:

[pp@test]$ /usr/local/bin/sflowtool
startDatagram =================================
datagramSourceIP 10.0.0.112
datagramSize 144
unixSecondsUTC 1285928093
datagramVersion 5
agentSubId 0
agent 10.0.0.112
packetSequenceNo 62
sysUpTime 995000
samplesInPacket 1
startSample ----------------------
sampleType_tag 0:1
sampleType FLOWSAMPLE
sampleSequenceNo 28
sourceId 3:65537
meanSkipCount 1
samplePool 28
dropEvents 0
inputPort 0
outputPort 1073741823
flowBlock_tag 0:2100
extendedType socket4
socket4_ip_protocol 6
socket4_local_ip 10.0.0.112
socket4_remote_ip 10.0.0.111
socket4_local_port 11211
socket4_remote_port 40091
flowBlock_tag 0:2200
flowSampleType memcache
memcache_op_protocol 1
memcache_op_cmd 7
memcache_op_key ms%5Fsetting%2Ec
memcache_op_nkeys 1
memcache_op_value_bytes 26953
memcache_op_duration_uS 0
memcache_op_status 1
endSample   ----------------------
endDatagram   =================================

The text displayed above represents a sampled Memcached operation. The value of memcache_op_cmd is 7, indicating that this is a GET operation (see sFlow for memcached). The value of memcached_op_key shows the Memcached key is ms%5Fsetting%2Ec
Note: sflowtool prints keys using URL encoding, so the actual key was ms_setting.c

Turning this raw data into something more useful requires a script. The following Perl script, topkeys.pl, runs sflowtool and processes the output to display the top 20 keys every minute:

#!/usr/bin/perl -w
use strict;
use POSIX;

sub min ($$) { $_[$_[0] > $_[1]] }

my %key_count = ();
my $start = time();
open(PS, "/usr/local/bin/sflowtool|") || die "Failed: $!\n";
while( <PS> ) {
  my ($attr,$value) = split;
  if('memcache_op_key' eq $attr) {
    $value =~ s/\%([A-Fa-f0-9]{2})/pack('C', hex($1))/seg;
    $key_count{$value}++;
  }
  my $now = time();
  if($now - $start >= 60) {
    printf "=== %s ===\n", strftime('%m/%d/%Y %H:%M:%S', localtime);
    my @sorted = sort { $key_count {$b} <=> $key_count {$a}} keys %key_count;
    for(my $i = 0; $i < min(20,@sorted); $i++) {
      my $key = $sorted[$i];
      printf "%2d %3d %s\n", $i + 1, $key_count{$key}, $key;
    }
    %key_count = ();
    $start = $now;
  }
}

close(PS);

The resulting output displays a sorted table of the hot keys:

./topkeys.pl
=== 10/01/2010 13:59:28 ===
 1  13 stopping.html.de
 2  11 sitemap.html.de
 3  10 install.html.de
 4   9 index.html.de
 5   9 invoking.html.de
 6   9 new_features_2_0.html.de
 7   7 upgrading.html.de
 8   5 bind.html
 9   4 invoking.html
10   4 dso.html
11   3 sitemap.html
12   3 server-wide.html
13   3 filter.html
14   3 logs.html
15   2 env.html
16   2 sections.html
17   2 index.html
18   2 suexec.html
19   2 configuring.html
20   2 new_features_2_0.html

The table shows that the top key is stopping.html.de, having occurred in 13 samples during the minute.

This example can be extended to display top clients, top operations, etc. In order to generate quantitatively accurate results, see Packet Sampling Basics, to see how to properly scale sFlow data.