There are a number of APIs and tools available for managing large cloud server deployments in the Rackspace cloud. However, the web interface provides the quickest solution for setting up the small number of cloud servers used in this example:
In this example, three cloud servers have been created: two Fedora Linux servers and a Windows 2003 server. The following diagram shows the network topology that connects the cloud servers:
Each cloud server is provides with a public IP address and a private IP address. The private network is intended for inter-server communication and there are no usage charges. Bandwidth on the public network is metered and usage-based charges apply.
In this example, the sFlow analyzer has been installed on the server, Web. In order to provide sFlow monitoring, open source Host sFlow agents were installed on the Linux and Windows cloud servers. The sFlow agents were configured to send sFlow to the private address on Web (10.180.164.230).
By default, Rackspace creates Linux cloud servers with a restrictive firewall configuration. The firewall configurations were modified (changes shown in red) to implement packet sampling and allow sFlow datagrams to be received from the private network interface (eth1).
[root@web ~]# more /etc/sysconfig/iptables
# Firewall configuration written by system-config-firewall
# Manual customization of this file is not recommended.
*filter
:INPUT ACCEPT [0:0]
:FORWARD ACCEPT [0:0]
:OUTPUT ACCEPT [0:0]
-A INPUT -i lo -j ACCEPT
-A INPUT -m statistic --mode random --probability 0.01 -j ULOG --ulog-nlgroup 1
-A INPUT -m state --state ESTABLISHED,RELATED -j ACCEPT
-A INPUT -p icmp -j ACCEPT
-A INPUT -p udp --dport 6343 -i eth1 -j ACCEPT
-A INPUT -m state --state NEW -m tcp -p tcp --dport 22 -j ACCEPT
-A INPUT -m state --state NEW -m tcp -p tcp --dport 80 -j ACCEPT
-A INPUT -j REJECT --reject-with icmp-host-prohibited
-A FORWARD -j REJECT --reject-with icmp-host-prohibited
-A OUTPUT -m statistic --mode random --probability 0.01 -j ULOG --ulog-nlgroup 1
COMMIT
Note: On Linux systems, Host sFlow uses the iptables ULOG facility to monitor network traffic, see ULOG for a more detailed discussion.
The Host sFlow agents were configured to poll counters every 30 seconds and pick up the packet samples via ULOG, sending the resulting sFlow to collector, 10.180.164.230:
[root@web ~]# more /etc/hsflowd.conf
sflow {
  DNSSD = off
  polling = 30
  sampling = 400

  collector {
    ip = 10.180.164.230
  }

  ulogGroup = 1
  ulogProbability = 0.01
}
Two sFlow analyzers were installed on cloud servers in order to demonstrate different aspects of sFlow analysis: the open source Ganglia cluster monitoring application and the commercial Traffic Sentinel application from InMon Corp. Both applications are easily installed on a Linux cloud server. Both tools also provide web-based interfaces, making them well suited to cloud deployment.
An advantage of using the sFlow standard for server monitoring is that it provides a multi-vendor solution. Windows and Linux servers export standard metrics that link network and system performance and allow a wide variety of analysis applications to be used.
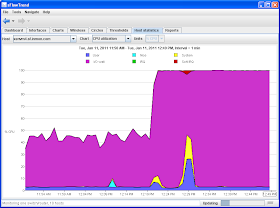
The following web browser screen shot shows Ganglia displaying the performance of the cloud servers:
The charts present a cluster-wide view of performance, with statistics combined from all the servers.
Drilling down to an individual server provides a detailed view of the server's performance:
Traffic Sentinel provides similar functionality when presenting server performance. The following screen shows a cluster-wide view of performance:
In addition, the top servers page, shown below, provides a real-time view comparing the performance of the busiest servers in the cluster.
The sFlow standard originated as a way to monitor network performance and is supported by most switch vendors. The following chart demonstrates some of the visibility into network traffic available using sFlow:
The chart shows a protocol breakdown of the network traffic to the cloud servers. For a more detailed view, the following application map shows how network monitoring can be used to track the complex relationships between the cloud servers:
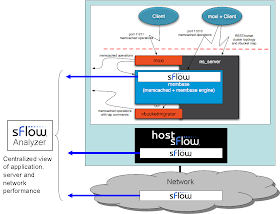
In addition to monitoring server and network performance, sFlow can also be used to monitor performance of the scale-out applications that are typically deployed in the cloud, including: web farms, memcached and membase clusters.
The sFlow standard is extremely well suited for cloud performance monitoring. The scalability of sFlow allows tens of thousands of cloud servers to be centrally monitored. With sFlow, data is continuously sent from the cloud servers to the sFlow analyzer, providing a real-time view of performance across the cloud.
The sFlow push model is much more efficient than typical monitoring architectures that require the management system to periodically poll servers for statistics. Polling breaks down in highly dynamic cloud environments where servers can appear and disappear. With sFlow, cloud servers are automatically discovered and continuously monitored as soon as they are created. The sFlow messages act as a server heartbeat, providing rapid notification when a server is deleted and stops sending sFlow.
Finally, sFlow provides the detailed, real-time, visibility into network, server and application performance needed to manage performance and control costs. For anyone interested in more information on sFlow, the sFlow presentation provides a strategic view of the role that sFlow monitoring plays in converged, virtualized and cloud environments.


