Tuesday, January 25, 2011
Membase
Membase is a scale-out NoSQL persistent data store built on Memcached. Membase simplifies typical Memcached deployments by combining the memory cache and database servers into a single cluster of Membase servers.
Monitoring the performance of a Membase cluster provides an interesting demonstration of the value of the integrated monitoring of network, system and application performance that is possible using sFlow instrumentation embedded in each of the layers.
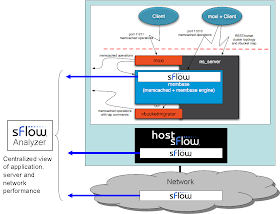
The following diagram demonstrates how sFlow can be used to fully instrument Membase servers:
The memcache protocol is used to access Membase and there is a Memcached server running at the core of each Membase server. The article, Memcached, describes how sFlow can be included in a Memcached server and the articles, Memcached hot keys and Memcached missed keys, describe some applications. Integrating sFlow in Memcached server included in Membase provides detailed visibility into memcache performance counters and operations.
Installing the Host sFlow agent on the servers within the Membase cluster provides visibility into server performance, see Cluster performance and Top servers. Finally, sFlow provides visibility into cluster-wide network performance, see Hybrid server monitoring and ULOG.
The measurements from applications, servers and network combine to provided an integrated view of performance (see sFlow Host Structures).
The following diagram shows a simple experimental setup constructed to explore performance:
A cluster of three Membase servers, 10.0.0.152, 10.0.0.153 and 10.0.0.156 provides scale-out storage to an Apache web server, 10.0.0.150. Client requests to the web server invoke application code in the web server that makes memcache requests to Membase server 10.0.0.152 which acts as a proxy, retrieving data from members of the cluster. In this setup Membase has been configured with a replication factor of 2 (each item stored on a server is replicated to the other two servers).
Note: The Apache web server has also been instrumented with sFlow, providing visibility into web requests (see HTTP), server performance and network activity.
The Membase web console shows the three members of the cluster:
Looking at network traffic using the free sFlowTrend analyzer clearly shows the relationships between the elements. The following Circles chart shows three clusters of machines, three Membase servers, one web server and four clients.
In the circles view, each cluster of servers is represented as a circle of dots, each dot representing a server. The line thicknesses correspond to data rates and the colors represent the different protocols. The thin yellow line (TCP port 80) is web traffic from the clients to the web server. The thick red line (TCP port 11211) is memcache traffic between the web server and the Membase cluster. Orange lines (TCP port 11210) within the Membase cluster are memcache replication and proxy traffic between the members of the cluster.
Note: The chart is an example of using sFlow for Application mapping.
One of the features of Membase is the ability to easily add and remove servers from the operational cluster. The server 10.0.0.158 was removed from the cluster and then added back a few minutes later. The following chart shows a spike in traffic as the server was removed and a much larger spike when the server was added back.
The web, memcache and proxy traffic associated with each server is clearly visible in the chart. The essential functions of the Membase cluster are critically dependent on network bandwidth and latency and managing network capacity is essential to ensure performance of the Membase cluster.
Note: Membase is an example of a broad class of scale-out applications which all share a dependency on the network for inter-cluster communication and scalability. Other examples discussed on this blog include: scale-out compute and storage clusters and virtualization pools with virtual machine migration.
The following chart from the Membase web console shows the throughput of the cluster during the interval of the test:
The graph shows a surprising 40% increase in performance when the server was removed and even more surprisingly the graph shows the increased performance persisting after the server was added back to the cluster.
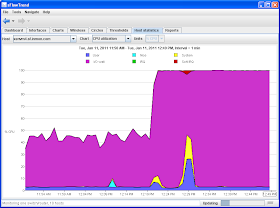
Looking at performance data from the servers should give a clue as to the source of the non-linear performance characteristics. The following chart shows data from the Host sFlow agent installed on one of the Membase servers.
The CPU load jumped from 45% to 100% at the time the server was removed from the cluster. While there were spikes in User and System loads when the server was removed and added to the cluster, there is a persistent increase in I/O Wait load.
The following chart shows that the CPU load on the web server also experienced an increase in I/O Wait load.
In this experiment, the servers are all virtual machines hosted on a single server. The following chart shows performance data from the Host sFlow agent installed on the hypervisor:
Again, there is a jump in I/O Wait load corresponding to the increase in cluster throughput.
In a virtualized environment, network and CPU loads are closely related since networking is handled by a software virtual switch running on the server. Virtual machines and network loads compete for the same physical CPUs, creating a non-linear feedback loop. This step change in performance appears to be what is referred to as a "phase change".
The article, On Traffic Phase Effects in Packet-Switched Gateways, describes phase changes that occur in physical networks. What appears to be happening here is that the spike in network load caused by the cluster reconfiguration created larger batches of network traffic for the virtual switch to handle. As the larger batches of packets pass through the switch, they provide more work for each virtual machine during its next CPU time slot, which in turn creates a larger batch of packets for the virtual switch, sustaining the cycle. The result is more efficient use of resources and an overall increase in throughput.
While it is unlikely that this specific behavior will occur in production Membase installations, it does demonstrate the complex relationship between applications, systems and networking. There are many examples of large scale performance problems caused by non-linear behavior in multi-layer, scale-out application architectures (e.g. Gmail outage, Facebook outage, Cache miss storm/stampede etc.).
The sFlow standard provides scalable monitoring of all the application, storage, server and network elements in the data center, both physical and virtual. Implementing an sFlow monitoring solution helps break down management silos, ensuring the coordination of resources needed to manage converged infrastructures, optimize performance and avoid service failures.


No comments:
Post a Comment