Tuesday, March 24, 2020

Kubernetes testbed

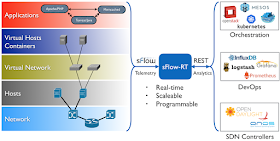
The sFlow-RT real-time analytics platform receives a continuous telemetry stream from sFlow Agents embedded in network devices, hosts and applications and converts the raw measurements into actionable metrics, accessible through open APIs, see Writing Applications.

Application development is greatly simplified if you can emulate the infrastructure you want to monitor on your development machine. Docker testbed describes a simple way to develop sFlow based visibility solutions. This article describes how to build a Kubernetes testbed to develop and test configurations before deploying solutions into production.
Docker Desktop provides a convenient way to set up a single node Kubernetes cluster, just select the Enable Kubernetes setting and click on Apply & Restart.

Create the following sflow-rt.yml file:
apiVersion: v1
kind: Service
metadata:
  name: sflow-rt-sflow
spec:
  type: NodePort
  selector:
    name: sflow-rt
  ports:
    - protocol: UDP
      port: 6343
---
apiVersion: v1
kind: Service
metadata:
  name: sflow-rt-rest
spec:
  type: LoadBalancer
  selector:
    name: sflow-rt
  ports:
    - protocol: TCP
      port: 8008
---
apiVersion: apps/v1
kind: Deployment
metadata:
  name: sflow-rt
spec:
  replicas: 1
  selector:
    matchLabels:
      name: sflow-rt
  template:
    metadata:
      labels:
        name: sflow-rt
    spec:
      containers:
      - name: sflow-rt
        image: sflow/prometheus:latest
        ports:
          - name: http
            protocol: TCP
            containerPort: 8008
          - name: sflow
            protocol: UDP
            containerPort: 6343
Run the following command to deploy the service:
kubectl apply -f sflow-rt.yml
Now create the following host-sflow.yml file:
apiVersion: apps/v1
kind: DaemonSet
metadata:
  name: host-sflow
spec:
  selector:
    matchLabels:
      name: host-sflow
  template:
    metadata:
      labels:
        name: host-sflow
    spec:
      restartPolicy: Always
      hostNetwork: true
      dnsPolicy: ClusterFirstWithHostNet
      containers:
      - name: host-sflow
        image: sflow/host-sflow:latest
        env:
          - name: COLLECTOR
            value: "sflow-rt-sflow"
          - name: SAMPLING
            value: "10"
          - name: NET
            value: "flannel"
        volumeMounts:
          - mountPath: /var/run/docker.sock
            name: docker-sock
            readOnly: true
      volumes:
        - name: docker-sock
          hostPath:
            path: /var/run/docker.sock
Run the following command to deploy the service:
kubectl apply -f host-sflow.yml
In this case, there is only one node, but the command will deploy an instance of Host sFlow on every node in a Kubernetes cluster to provide a comprehensive view of network, server, and application performance.

Note: The single node Kubernetes cluster uses the Flannel plugin for Cluster Networking. Setting the sflow/host-sflow environment variable NET to flannel instruments the cni0 bridge used by Flannel to connect Kubernetes pods. The NET and SAMPLING settings will likely need to be changed when pushing the configuration into a production environment, see sflow/host-sflow for options.

Run the following command to verify that the Host sFlow and sFlow-RT pods are running:
kubectl get pods
The following output:
NAME                        READY   STATUS    RESTARTS   AGE
host-sflow-lp4db            1/1     Running   0          34s
sflow-rt-544bff645d-kj4km   1/1     Running   0          21h
The following command displays the network services:
kubectl get services
Generating the following output:
NAME             TYPE           CLUSTER-IP      EXTERNAL-IP   PORT(S)          AGE
kubernetes       ClusterIP      10.96.0.1       <none>        443/TCP          13d
sflow-rt-rest    LoadBalancer   10.110.89.167   localhost     8008:31317/TCP   21h
sflow-rt-sflow   NodePort       10.105.87.169   <none>        6343:31782/UDP   21h
Access to the sFlow-RT REST API is available via localhost port 8008.
The sFlow-RT web interface confirms that telemetry is being received from 1 sFlow agent (the Host sFlow instance monitoring the Kubernetes node).
ab -c 4 -n 10000 -b 500 -l http://10.0.0.73:8008/dump/ALL/ALL/json
The command above uses the ab - Apache HTTP server benchmarking tool to generate network traffic by repeatedly querying the sFlow-RT instance using the Kubernetes node IP address (10.0.0.73).
The screen capture above shows the sFlow-RT Flow Browser application reporting traffic in real-time.
#!/usr/bin/env python
import requests

requests.put(
  'http://10.0.0.73:8008/flow/elephant/json',
  json={'keys':'ipsource,ipdestination', 'value':'bytes'}
)
requests.put(
  'http://10.0.0.73:8008/threshold/elephant_threshold/json',
  json={'metric':'elephant', 'value': 10000000/8, 'byFlow':True, 'timeout': 1}
)
eventurl = 'http://10.0.0.73:8008/events/json'
eventurl += '?thresholdID=elephant_threshold&maxEvents=10&timeout=60'
eventID = -1
while 1 == 1:
  r = requests.get(eventurl + '&eventID=' + str(eventID))
  if r.status_code != 200: break
  events = r.json()
  if len(events) == 0: continue

  eventID = events[0]['eventID']
  events.reverse()
  for e in events:
    print(e['flowKey'])
The above elephant.py script is modified from the version in Docker testbed to reference the Kubernetes node IP address (10.0.0.73).
./elephant.py     
10.1.0.72,192.168.65.3
The output above is generated immediately when traffic is generated using the ab command. The IP addresses correspond to those displayed in the Flow Browser chart.
curl http://10.0.0.73:8008/prometheus/metrics/ALL/ALL/txt
Run the above command to metrics from the Kubernetes cluster exported using Prometheus export format.

This article was focussed on using Docker Desktop to move sFlow real-time analytics solutions into a Kubernetes production environment. Docker testbed describes how to use Docker Desktop to create an environment to develop the applications.

Thursday, March 19, 2020

SFMIX San Francisco shelter in place

A shelter in place order restricted San Francisco residents to their homes beginning at 12:01 a.m. on March 17, 2020. Many residents work for Bay Area technology companies such as Salesforce, Facebook, Twitter, Google, Netflix and Apple. Employees from these companies are able to, and have been instructed to, work remotely from their homes. In addition, other housebound residents are making use of social networking to keep in touch with friends and family as well as streaming media and online gaming for entertainment.

The traffic trend chart above from the San Francisco Metropolitan Internet Exchange (SFMIX) shows the change in network traffic that has resulted from the shelter in place order. Peak traffic has increased by around 10Gbit/s (a 25% increase) and continues throughout the day (whereas peaks previously occurred in the evenings).

The SFMIX network directly connects a number of data centers in the Bay Area and the member organizations that peer from those data centers.  Peering through the exchange network keeps traffic local by directly connecting companies with their employees and customers and avoiding potentially congested service provider networks.
SFMIX recently finished a network upgrade to 100Gbit/s Arista switches and all fiber optic connections and so is easily able to handle the increase in traffic.

Network visibility is critical to being able to quickly respond to unexpected changes in network usage. The sFlow measurement technology built into high speed switches is a standard method of monitoring Internet Exchanges (IXs) - Internet Exchange (IX) Metrics is a measurement tool developed with SFMIX.

Every organization depends on their networks and visibility is critical to manage the challenges posed by a rapidly changing environment. sFlow is an industry standard that is widely implemented by network vendors.  Enable sFlow telemetry from existing network equipment and deploy an sFlow analytics tool to gain visibility into your network traffic. sFlowTrend is a free tool that can be installed and running in minutes. Flow metrics with Prometheus and Grafana describes how to integrate network traffic visibility into existing operational dashboards.

Thursday, March 12, 2020

Ubuntu 18.04

Ubuntu 18.04 comes with Linux kernel version 4.15. This version of the kernel includes efficient in-kernel packet sampling that can be used to provide network visibility for production servers running network heavy workloads, see Berkeley Packet Filter (BPF).
This article provides instructions for installing and configuring the open source Host sFlow agent to remotely monitor servers using the industry standard sFlow protocol. The sFlow-RT real-time analyzer is used to demonstrate the capabilities of sFlow telemetry.

Find the latest Host sFlow version on the Host sFlow download page.
wget https://github.com/sflow/host-sflow/releases/download/v2.0.25-3/hsflowd-ubuntu18_2.0.25-3_amd64.deb
sudo dpkg -i hsflowd-ubuntu18_2.0.25-3_amd64.deb
sudo systemctl enable hsflowd
The above commands download and install the software.
sflow {
  collector { ip=10.0.0.30 }
  pcap { speed=1G-1T }
  tcp { }
  systemd { }
}
Edit the /etc/hsflowd.conf file. The above example sends sFlow to a collector at 10.0.0.30, enables packet sampling on all network adapters, adds TCP performance information, and exports metrics for Linux services. See Configuring Host sFlow for Linux for the complete set of configuration options.
sudo systemctl restart hsflowd
Restart the Host sFlow daemon to start streaming telemetry to the collector.
sflow {
  dns-sd { domain=.sf.inmon.com }
  pcap { speed=1G-1T }
  tcp { }
  systemd { }
}
Alternatively, if you have control over a DNS domain, you can use DNS SRV records to advertise sFlow collector address(es). In the above example, the sf.inmon.com domain will be queried for collectors.
sflow-rt          A       10.0.0.30
_sflow._udp   60  SRV     0 0 6343  sflow-rt
The above entries from the sf.inmon.com zone file directs the sFlow to sflow-rt.sf.inmon.com (10.0.0.30). If you change the collector, all Host sFlow agents will pick up the change within 60 seconds (the DNS time to live specified in the SRV entry).

Now that the Host sFlow agent has been configured, it's time to install an sFlow collector on server 10.0.0.30, which we will assume is also running Ubuntu 18.04.

First install Java.
sudo apt install openjdk-11-jre-headless
Next, install the latest version of sFlow-RT along with browse-metrics, browse-flows and prometheus applications.
LATEST=`wget -qO - https://inmon.com/products/sFlow-RT/latest.txt`
wget https://inmon.com/products/sFlow-RT/sflow-rt_$LATEST.deb
sudo dpkg -i sflow-rt_$LATEST.deb
sudo /usr/local/sflow-rt/get-app.sh sflow-rt browse-metrics
sudo /usr/local/sflow-rt/get-app.sh sflow-rt browse-flows
sudo /usr/local/sflow-rt/get-app.sh sflow-rt prometheus
sudo systemctl enable sflow-rt
sudo systemctl start sflow-rt
Finally, allow sFlow and HTTP requests through the firewall.
sudo ufw allow 6343/udp
sudo ufw allow 8008/tcp
System Properties describes configuration options that can be set in the /usr/local/sflow-rt/conf.d/sflow-rt.conf file. See Download and install for instructions on securing access to sFlow-RT as well as links to additional applications.
Use a web browser to connect to http://10.0.0.30:8008/ to access the sFlow-RT web interface (shown above). The Status page confirms that sFlow is being received.
curl http://10.0.0.30:8008/prometheus/metrics/ALL/ALL/txt
The above command retrieves metrics for all the hosts in Prometheus export format.

Configure Prometheus or InfluxDB to periodically retrieve and store metrics. The following examples demonstrate the use of Grafana to query a Prometheus database to populate dashboards: sFlow-RT Network Interfaces, sFlow-RT Countries and Networks, and sFlow-RT Health.

Tuesday, March 10, 2020

Docker testbed

The sFlow-RT real-time analytics platform receives a continuous telemetry stream from sFlow Agents embedded in network devices, hosts and applications and converts the raw measurements into actionable metrics, accessible through open APIs, see Writing Applications.

Application development is greatly simplified if you can emulate the infrastructure you want to monitor on your development machine. Mininet flow analyticsMininet dashboard, and Mininet weathermap describe how to use the open source Mininet network emulator to simulate networks and generate a live stream of standard sFlow telemetry data.

This article describes how to use Docker containers as a development platform. Docker Desktop provides a convenient method of running Docker on Mac and Windows desktops. These instructions assume you have already installed Docker.

Start a Host sFlow agent using the pre-built sflow/host-sflow image:
docker run --rm -d -e "COLLECTOR=host.docker.internal" -e "SAMPLING=10" \
--net=host -v /var/run/docker.sock:/var/run/docker.sock:ro \
--name=host-sflow sflow/host-sflow
Note: Host, Docker, Swarm and Kubernetes monitoring describes how to deploy Host sFlow agents to monitor large scale container environments.

Start an iperf3 server using the pre-built sflow/iperf3 image:
docker run --rm -d -p 5201:5201 --name iperf3 sflow/iperf3 -s
In a separate terminal window, run the following command to start sFlow-RT:
docker run --rm -p 8008:8008 -p 6343:6343/udp --name sflow-rt sflow/prometheus
Note: The sflow/prometheus image is based on sflow/sflow-rt, adding applications for browsing and exporting sFlow analytics. The sflow/sflow-rt page provides instructions for packaging your own applications with sFlow-RT.

It is helpful to run sFlow-RT in foreground during development so that you can see the log messages:
2020-03-09T23:31:23Z INFO: Starting sFlow-RT 3.0-1477
2020-03-09T23:31:23Z INFO: Version check, running latest
2020-03-09T23:31:24Z INFO: Listening, sFlow port 6343
2020-03-09T23:31:24Z INFO: Listening, HTTP port 8008
2020-03-09T23:31:24Z INFO: DNS server 192.168.65.1
2020-03-09T23:31:24Z INFO: app/prometheus/scripts/export.js started
2020-03-09T23:31:24Z INFO: app/browse-flows/scripts/top.js started
The web user interface can be accessed at http://localhost:8008/.
The sFlow Agents count (at the top left) verifies that sFlow is being received from the Host sFlow agent. Access the pre-installed Browse Flows application at http://localhost:8008/app/browse-flows/html/index.html?keys=ipsource%2Cipdestination&value=bps
Run the following command in the original terminal to initiate a test and generate traffic:
docker run --rm sflow/iperf3 -c host.docker.internal
You should immediately see a spike in traffic like that shown in the Flow Browser screen capture. See RESTflow for an overview of the sFlow-RT flow analytics architecture and  Defining Flows for a detailed description of the options available when defining flows.

The ability to rapidly detect and act on traffic flows addresses many important challenges, for example: Real-time DDoS mitigation using BGP RTBH and FlowSpecTriggered remote packet capture using filtered ERSPAN, Exporting events using syslogBlack hole detection. and Troubleshooting connectivity problems in leaf and spine fabrics.

The following elephant.js script uses the embedded JavaScript API to detect and log the start of flows greater than 10Mbits/second:
setFlow('elephant',
  {keys:'ipsource,ipdestination',value:'bytes'});
setThreshold('elephant_threshold',
  {metric:'elephant', value: 10000000/8, byFlow: true, timeout: 1});
setEventHandler(function(evt)
  { logInfo(evt.flowKey); }, ['elephant_threshold']);
Use control+c to stop the sFlow-RT instance and run the following command to include the elephant.js script:
docker run --rm -v $PWD/elephant.js:/sflow-rt/elephant.js \
-p 8008:8008 -p 6343:6343/udp --name sflow-rt \
sflow/prometheus -Dscript.file=elephant.js
Run the iperf3 test again and you should immediately see the flows logged:
2020-03-10T05:30:15Z INFO: Starting sFlow-RT 3.0-1477
2020-03-10T05:30:16Z INFO: Version check, running latest
2020-03-10T05:30:16Z INFO: Listening, sFlow port 6343
2020-03-10T05:30:17Z INFO: Listening, HTTP port 8008
2020-03-10T05:30:17Z INFO: DNS server 192.168.65.1
2020-03-10T05:30:17Z INFO: elephant.js started
2020-03-10T05:30:17Z INFO: app/browse-flows/scripts/top.js started
2020-03-10T05:30:17Z INFO: app/prometheus/scripts/export.js started
2020-03-10T05:30:25Z INFO: 172.17.0.4,192.168.1.242
2020-03-10T05:30:26Z INFO: 172.17.0.1,172.17.0.2
Alternatively, the following elephant.py script used the REST API to perform the same function:
#!/usr/bin/env python
import requests

requests.put(
  'http://localhost:8008/flow/elephant/json',
  json={'keys':'ipsource,ipdestination', 'value':'bytes'}
)
requests.put(
  'http://localhost:8008/threshold/elephant_threshold/json',
  json={'metric':'elephant', 'value': 10000000/8, 'byFlow':True, 'timeout': 1}
)
eventurl = 'http://localhost:8008/events/json'
eventurl += '?thresholdID=elephant_threshold&maxEvents=10&timeout=60'
eventID = -1
while 1 == 1:
  r = requests.get(eventurl + '&eventID=' + str(eventID))
  if r.status_code != 200: break
  events = r.json()
  if len(events) == 0: continue

  eventID = events[0]['eventID']
  events.reverse()
  for e in events:
    print(e['flowKey'])
Run the Python script and run another iperf3 test:
./elephant.py 
172.17.0.4,192.168.1.242
172.17.0.1,172.17.0.2
Another option is to replay sFlow telemetry captured in the form of a PCAP file. The Fabric View application contains an example that can be extracted:
curl -O https://raw.githubusercontent.com/sflow-rt/fabric-view/master/demo/ecmp.pcap
Now run sFlow-RT:
docker run --rm -v $PWD/ecmp.pcap:/sflow-rt/sflow.pcap \
-p 8008:8008 --name sflow-rt sflow/prometheus -Dsflow.file=sflow.pcap
Run the elephant.py script:
./elephant.py                                                            
10.4.1.2,10.4.2.2
10.4.1.2,10.4.2.2
Note: Fabric View contains a detailed description of the captured data.

Data from a production network can be captured using tcpdump:
tcpdump -i eth0 -s 0 -c 10000 -w sflow.pcap udp port 6343
For example, the above command captures 10000 sFlow datagrams (UDP port 6343) from Ethernet interface eth0 and stores them in file sflow.pcap

The sFlow-RT analytics engine converts raw sFlow telemetry into useful metrics that can be imported into a time series database.
curl http://localhost:8008/prometheus/metrics/ALL/ALL/txt
The above command retrieves metrics for all the hosts in Prometheus export format. Prometheus exporter describes how run the Prometheus time series database and build Grafana dashboards using metrics retrieved from sFlow-RT. Flow metrics with Prometheus and Grafana extends the example to include packet flow data. InfluxDB 2.0 shows how to import and query metrics using InfluxDB.

It only takes a few minutes to try out these examples. Work through Writing Applications to learn about the capabilities of the sFlow-RT analytics engine and how to package applications. Publish applications on GitHub and use the sflow/sflow-rt Docker image to deploy them in production. Join the sFlow-RT Community to ask questions and post information new applications.    

Friday, March 6, 2020

CentOS 8

CentOS 8 / RHEL 8 come with Linux kernel version 4.18. This version of the kernel includes efficient in-kernel packet sampling that can be used to provide network visibility for production servers running network heavy workloads, see Berkeley Packet Filter (BPF).
This article provides instructions for installing and configuring the open source Host sFlow agent to remotely monitor servers using the industry standard sFlow protocol. The sFlow-RT real-time analyzer is used to demonstrate the capabilities of sFlow telemetry.

Find the latest Host sFlow version on the Host sFlow download page.
wget https://github.com/sflow/host-sflow/releases/download/v2.0.26-3/hsflowd-centos8-2.0.26-3.x86_64.rpm
sudo rpm -i hsflowd-centos8-2.0.26-3.x86_64.rpm
sudo systemctl enable hsflowd
The above commands download and install the software.
sflow {
  collector { ip=10.0.0.30 }
  pcap { speed=1G-1T }
  tcp { }
  systemd { }
}
Edit the /etc/hsflowd.conf file. The above example sends sFlow to a collector at 10.0.0.30, enables packet sampling on all network adapters, adds TCP performance information, and exports metrics for Linux services. See Configuring Host sFlow for Linux for the complete set of configuration options.
sudo systemctl restart hsflowd
Restart the Host sFlow daemon to start streaming telemetry to the collector.
sflow {
  dns-sd { domain=.sf.inmon.com }
  pcap { speed=1G-1T }
  tcp { }
  systemd { }
}
Alternatively, if you have control over a DNS domain, you can use DNS SRV records to advertise sFlow collector address(es). In the above example, the sf.inmon.com domain will be queried for collectors.
sflow-rt          A       10.0.0.30
_sflow._udp   60  SRV     0 0 6343  sflow-rt
The above entries from the sf.inmon.com zone file directs the sFlow to sflow-rt.sf.inmon.com (10.0.0.30). If you change the collector, all Host sFlow agents will pick up the change within 60 seconds (the DNS time to live specified in the SRV entry).

Now that the Host sFlow agent has been configured, it's time to install an sFlow collector on server 10.0.0.30, which we will assume is also running CentOS 8.

First install Java.
sudo yum install java-11-openjdk-headless
Next, install the latest version of sFlow-RT along with browse-metrics, browse-flows and prometheus applications.
LATEST=`wget -qO - https://inmon.com/products/sFlow-RT/latest.txt`
wget https://inmon.com/products/sFlow-RT/sflow-rt-$LATEST.noarch.rpm
sudo rpm -i sflow-rt-$LATEST.noarch.rpm
sudo /usr/local/sflow-rt/get-app.sh sflow-rt browse-metrics
sudo /usr/local/sflow-rt/get-app.sh sflow-rt browse-flows
sudo /usr/local/sflow-rt/get-app.sh sflow-rt prometheus
sudo systemctl enable sflow-rt
sudo systemctl start sflow-rt
Finally, allow sFlow and HTTP requests through the firewall.
sudo firewall-cmd --permanent --zone=public --add-port=6343/udp
sudo firewall-cmd --permanent --zone=public --add-port=8008/tcp
sudo firewall-cmd --reload
System Properties describes configuration options that can be set in the /usr/local/sflow-rt/conf.d/sflow-rt.conf file. See Download and install for instructions on securing access to sFlow-RT as well as links to additional applications.
Use a web browser to connect to http://10.0.0.30:8008/ to access the sFlow-RT web interface (shown above). The Status page confirms that sFlow is being received.
curl http://10.0.0.30:8008/prometheus/metrics/ALL/ALL/txt
The above command retrieves metrics for all the hosts in Prometheus export format.

Configure Prometheus or InfluxDB to periodically retrieve and store metrics. The following examples demonstrate the use of Grafana to query a Prometheus database to populate dashboards: sFlow-RT Network InterfacessFlow-RT Countries and Networks, and sFlow-RT Health.