Monday, August 14, 2023

Containerlab dashboard

The GitHub sflow-rt/containerlab project contains example network topologies for the Containerlab network emulation tool that demonstrate real-time streaming telemetry in realistic data center topologies and network configurations. The examples use the same FRRouting (FRR) engine that is part of SONiC, NVIDIA Cumulus Linux, and DENT network operating systems. Containerlab can be used to experiment before deploying solutions into production. Examples include: tracing ECMP flows in leaf and spine topologies, EVPN visibility, and automated DDoS mitigation using BGP Flowspec and RTBH controls.
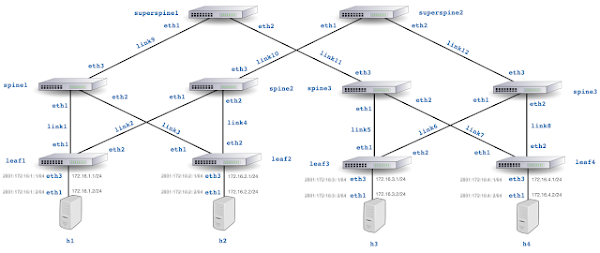
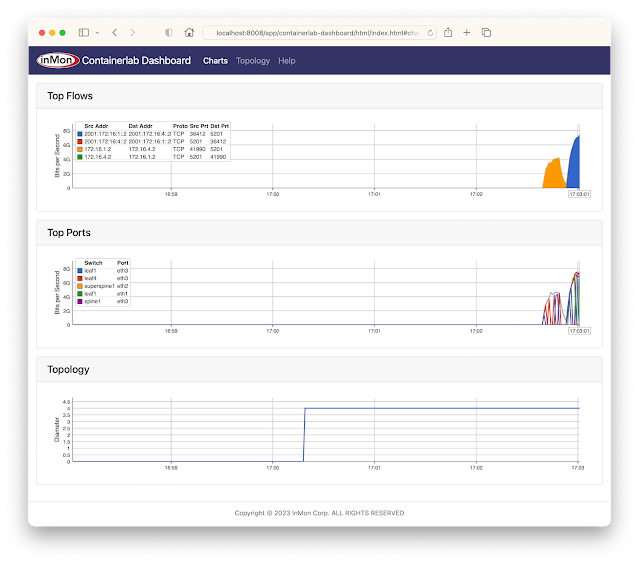
The screen capture at the top of this article shows a real-time dashboard displaying up to the second traffic analytics gathered from the 5 stage Clos fabric shown above. This article walks through the steps needed to run the example.
git clone https://github.com/sflow-rt/containerlab.git
cd containerlab
./run-clab
Run the above commands to download the project and run Containerlab on a system with Docker installed. Docker Desktop is a conventient way to run the labs on a laptop.
containerlab deploy -t clos5.yml
Start the emulation.
./topo.py clab-clos5
Post topology to sFlow-RT REST API. Connect to http://localhost:8008/app/containerlab-dashboard/html/ to access the Dashboard shown at the top of this article.
docker exec -it clab-clos5-h1 iperf3 -c 172.16.4.2
Each of the hosts in the network has an iperf3 server, so running the above command will test bandwidth between h1 and h4.
docker exec -it clab-clos5-h1 iperf3 -c 2001:172:16:4::2
Generate a large IPv6 flow between h1 and h4. The traffic flows should immediately appear in the Top Flows chart. You can check the accuracy by comparing the values reported by iperf3 with those shown in the chart.
Click on the Topology tab to see a real-time weathermap of traffic flowing over the topology. See how repeated iperf3 tests take different ECMP (equal-cost multi-path) routes across the network.
docker exec -it clab-clos5-leaf1 vtysh
Linux with open source routing software (FRRouting) is an accessible alternative to vendor routing stacks (no registration / license required, no restriction on copying means you can share images on Docker Hub, no need for virtual machines). FRRouting is popular in production network operating systems (e.g. Cumulus Linux, SONiC, DENT, etc.) and the VTY shell provides an industry standard CLI for configuration, so labs built around FRR allow realistic network configurations to be explored.
Connect to http://localhost:8008/ to access the main sFlow-RT status page, additional applications, and the REST API. See Getting Started for more information.
containerlab destroy -t clos5.yml
When you are finished, run the above command to stop the containers and free the resources associated with the emulation. Try out other topologies from the project to explore topics such as DDoS mitigation, BGP Flowspec, and EVPN.

Moving the monitoring solution from Containerlab to production is straightforward since sFlow is widely implemented in datacenter equipment from vendors including: A10, Arista, Aruba, Cisco, Edge-Core, Extreme, Huawei, Juniper, NEC, Netgear, Nokia, NVIDIA, Quanta, and ZTE. In addition, the open source Host sFlow agent makes it easy to extend visibility beyond the physical network into the compute infrastructure.

Tuesday, August 8, 2023

Grafana Network Weathermap

The screen capture above shows a simple network weathermap, displaying a network topology with links animated by real-time network analytics.
Hovering over a link in the weathermap pops up a trend chart showing traffic on the link over the last 30 minutes.

Deploy real-time network dashboards using Docker compose, describes how to quickly deploy a real-time network analytics stack that includes the sFlow-RT analytics engine, Prometheus time series database, and Grafana to create dashboards. This article describes how to extend the example using the Grafana Network Weathermap Plugin to display network topologies like the ones shown here.

First, add a dashboard panel and select the Network Weathermap visualization. Next define the three metrics shown above. The ifinoctets and ifoutoctets need to be scaled by 8 to convert from bytes per second to bits per second. Creating a custom legend entry makes it easier to select metrics to associate metric instances with weathermap links.
Add a color scale that will be used to color links by link utilization. Defining the scale first ensures that links will be displayed correctly when they are added later.
Add the nodes to the canvas and drag them to their desired locations. There is a large library of icons that can be used to indicate the node types. The Enable Node Grid Snapping makes it easier to line up nodes.
Add links to connect the nodes. Each link needs to be associated with in/out metrics and and a link speed. Setting the Side Anchor Point values correctly ensures a clean layout.

Network weathermaps are only one method of displaying network telemetry - work through the examples in Deploy real-time network dashboards using Docker compose to learn how to construct dashboards of trend charts and analyze traffic flows.