Thursday, November 21, 2024

SC24 Over 10 Terabits per Second of WAN Traffic

The SC24 WAN Stress Test chart shows 10.3 Terabits bits per second of WAN traffic to the The International Conference for High Performance Computing, Networking, Storage, and Analysis (SC24) conference held this week in Atlanta. The conference network used in the demonstration, SCinet, is described as the most powerful and advanced network on Earth, connecting the SC community to the world.

SC24 Real-time RoCEv2 traffic visibility describes a demonstration of wide area network bulk data transmission using RDMA over Converged Ethernet (RoCEv2) flows typically seen in AI/ML data centers. In the example, 3.2Tbits/second sustained trasmissions from sources geographically distributed around the United States was demonstrated.

SC24 Dropped packet visibility demonstration shows how the sFlow data model integrates three telemetry streams: counters, packet samples, and packet drop notifications. Each type of data is useful on its own, but together they provide the comprehensive network wide observability needed to drive automation. Real-time network visibility is particularly relevant to AI / ML data center networks where congestion and dropped packets can result in serious performance degradation and in this screen capture you can see multiple 400Gbits/s RoCEv2 flows.

SC24 SCinet traffic describes the architecture of the real-time monitoring system used to generate these charts. This chart shows that over 225 Petabytes of data were transfered during the show.

Wednesday, November 20, 2024

SC24 Real-time RoCEv2 traffic visibility

The chart shows eight 400Gbits/s RDMA over Converged Ethernet (RoCEv2) flows, typically seen in AI / ML data centers, totaling 3.2 Tbits/s. The unique challenge in this case is that flows are being routed from locations scattered around the United States to Atlanta, the location of the International Conference for High Performance Computing, Networking, Storage, and Analysis (SC24) conference.
SC24 Network Research Exhibit: The Resiliant, Performant Networks and Distributed Processing demonstration aims to explore performance limitations and enablers for high volume bulk data tranfers. Maintaining stable 400Gbits/s RoCEv2 connections over a wide area network is challenging since the packets have to traverse multiple links, avoid contention on links, and deal with buffering associated with transmission latency that is orders of magnitude higher than data center environments where RoCEv2 is typically deployed (one way latency across the USA is a minimum of 16 milliseconds due to speed of light, but in practice the latency is quite a bit larger, on the other hand latency across a leaf and spine data center fabric is measured in microseconds).
During setup it was noticed that total throughput with 8 concurrent flows was only 2.7Tbits/s (instead of the 3Tbits/second plus expected). Examining a real-time view of the throughput revealed that the two smallest flows, pink and light green at the top of the chart, were likely sharing a 400Gbits path since each flow was only transferring 200Gbps. The next flow down, light blue, appeared to be unstable and wasn't maintaining a constant 400Gbps.
Drilling down to look at the unstable flow showed that it was oscilating between 280Gbits/s and 400Gbits/s with a period of around 15 seconds. Further investigation revealed that the cause of the instability was a collision with a smaller flow on one of the links traversed by this flow. Once the flow collisions were resolved, all flows achieved close to 400Gbit/s, allowing the full 3Tbits/s transfer rate shown at the top of this article.
In this example, the sFlow-RT real-time analytics engine receives sFlow telemetry from switches, routers, and servers in the SCinet network and creates metrics to drive the real-time charts. Getting Started provides a quick introduction to deploying and using sFlow-RT for real-time network-wide flow analytics.

Real-time network visibility is particularly relevant to AI / ML data center networks where congestion and dropped packets can result in serious performance degredation of machine learning tasks. Industry standard sFlow instrumentation is supported by the high speed 400/800G switches currently being deployed in AI / ML data centers. Enabling sFlow analytics provides the visibility needed to optimize performance.

Network visibility complements existing system management tools used to provide visibility into compute nodes, extending visibility into the fabric to directly observe problems in the network that can't easily be inferred from the compute nodes, and providing a second pair of eyes with an independent view of performance.

Finally, check out the SC24 Dropped packet visibility demonstration to learn about one of newest developments in sFlow monitoring and see a live demonstration.

Tuesday, November 19, 2024

SC24 SCinet traffic

The real-time dashboard shows total network traffic at The International Conference for High Performance Computing, Networking, Storage, and Analysis (SC24) conference being held this week in Atlanta. The dashboard shows that 31 Petabytes of data have been transferred already and the conference has just started.

The conference network used in the demonstration, SCinet, is described as the most powerful and advanced network on Earth, connecting the SC community to the world.

In this example, the sFlow-RT real-time analytics engine receives sFlow telemetry from switches, routers, and servers in the SCinet network and creates metrics to drive the real-time charts in the dashboard. Getting Started provides a quick introduction to deploying and using sFlow-RT for real-time network-wide flow analytics.

Finally, check out the SC24 Dropped packet visibility demonstration to learn about one of newest developments in sFlow monitoring and see a live demonstration.

Monday, November 18, 2024

NVIDIA Cumulus Linux 5.11 for AI / ML


NVIDIA Cumulus Linux 5.11 includes major upgrades to the sFlow agent that fully exposes the advanced instrumentation built into NVIDIA Spectrum-X silicon. The enhanced real-time telemetry is particularly relevant to the AI / machine learning workloads that Spectrum-X is designed to handle.

With Cumulus Linux 5.11, the sFlow agent is easily configured using nvue commands, see Monitoring System Statistics and Network Traffic with sFlow:

nv set system sflow dropmon hw
nv set system sflow poll-interval 20
nv set system sflow collector 192.0.2.1
nv set system sflow state enabled
nv config apply

Note: In this case, enabling dropmon ensures that every dropped packet is captured, along with ingress port and drop reason (e.g. ttl_exceeded).

The same commands should be applied to every switch in the fabric for comprehensive visibility.

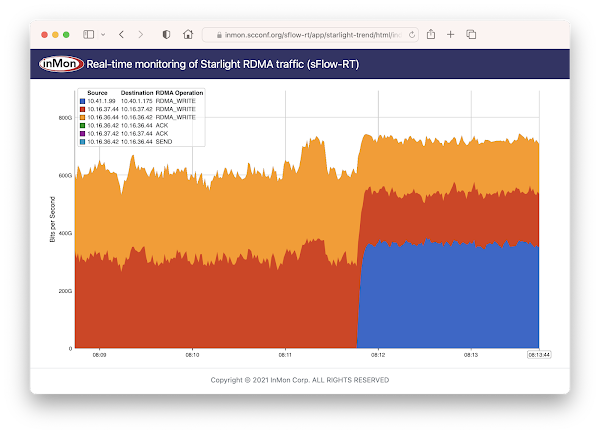
RDMA over Converged Ethernet (RoCE) describes how sFlow provides detailed visibility into RoCE flows used to move data between GPUs in an AI / ML data center fabric. The chart above from the RDMA network visibility demonstration at the SC22 conference shows that sFlow monitoring easily scales to the 400/800G speeds needed for machine learning.
In this example, the sFlow-RT real-time analytics engine receives sFlow telemetry from all the switches and servers in the fabric. Deploy real-time network dashboards using Docker compose describes how to quickly set up an sFlow-RT, Prometheus, Grafana stack to capture and display metrics. Dropped packet metrics with Prometheus and Grafana describes how to add a dashboard to display packet drop notifications.

If you are standing up a new NVIDIA Spectrum-X / Cumulus Linux network, enable sFlow on all the switches and set up an instance of sFlow-RT for the real-time fabric wide visibility into traffic flows and dropped packets. Real-time network visibility is particularly relevant to AI / ML data center networks where congestion and dropped packets can result in serious performance degradation.

Sunday, November 17, 2024

SC24 Dropped packet visibility demonstration

The real-time dashboard is a joint InMon / Arista demonstration at The International Conference for High Performance Computing, Networking, Storage, and Analysis (SC24) conference being held this week in Atlanta.

The conference network used in the demonstration, SCinet, is described as the most powerful and advanced network on Earth, connecting the SC community to the world.

The sFlow Packet Drop Monitoring In High Performance Networks dashboard combines telemetry from all the Arista switches in the SCinet network to provide real-time network-wide view of performance. Each of the three charts demonstrate a different type of measurement in the sFlow telemetry stream:

  • Counters: Total Traffic shows total traffic calculated from interface counters streamed from all interfaces. Counters provide a useful way of accurately reporting byte, frame, error and discard counters for each network interface. In this case, the chart rolls up data from all interfaces to trend total traffic on the network.
  • Samples: Top Flows shows the top 5 largest traffic flows traversing the network. The chart is based on sFlow's random packet sampling mechanism, providing a scaleable method of determining the hosts and services responsible for the traffic reported by the counters. Visibility into top flows is essential if one wants to take action to manage network usage and capacity: immediately identifying DDoS attacks, elephant flows, and tracking changing service demands.
    Note: Network addresses have been masked for privacy.
  • Notifications: Dropped Packets shows each dropped packet, the device that dropped it, and the reason it was dropped. Dropped packets have a profound impact on network performance and availability. Packet discards due to congestion can significantly impact application performance. Dropped packets due to black hole routes, expired TTLs, MTU mismatches, etc can result in insidious connection failures that are time consuming and difficult to diagnose.
    Note: Network addresses have been masked for privacy.
The sFlow data model integrates the three telemetry streams: counters, packet samples, and drop notifications. Each type of data is useful on its own, but together they provide the system wide observability needed to drive automation.
Dropped packet metrics with Prometheus and Grafana describes how to incorporate real-time dropped packet metrics into operational dashboards for rapid troubleshooting of network performance problems.

If you have Arista switches in your network, try enabling sFlow to gain insight into network traffic. Dropped packet notifications with Arista Networks, describes how to configure sFlow to include dropped packet notifications. Real-time network visibility is particularly relevant to AI / ML data center networks where congestion and dropped packets can result in serious performance degredation.

Tuesday, November 12, 2024

Worldwide deployment of real-time flow analytics

Industry standard sFlow telemetry is widely supported by network equipment vendors and network management platforms. However, the advent of real-time sFlow analytics has opened up a range of new applications for sFlow. The map above shows the proportion of sFlow-RT instances running in each of the over 70 countries in which it is deployed.

The following use cases are driving current deployments:

Addressing the challenge of operating AI / ML clusters is the emerging application for sFlow visibility. High speed (400/800G) data center switches needed to handle machine learning traffic flows include sFlow agents and real-time analytics are essential to optimize the network so that expensive GPU and compute resources are fully utilized, see Leveraging open technologies to monitor packet drops in AI cluster fabrics.

If you would like to see how real-time network analytics can transform network operations, Getting Started describes how to download and configure sFlow-RT analytics software for use in your network, or how to try it out using an emulator, or pre-captured data.