Friday, November 17, 2023
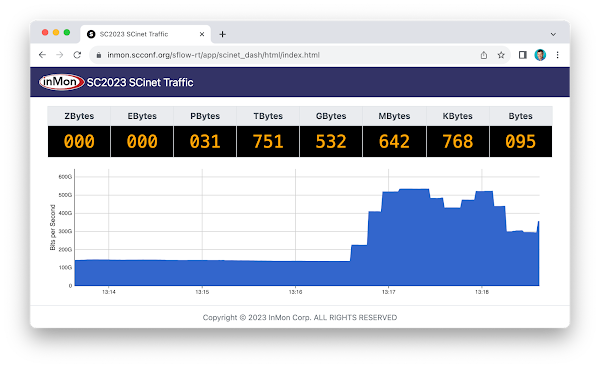
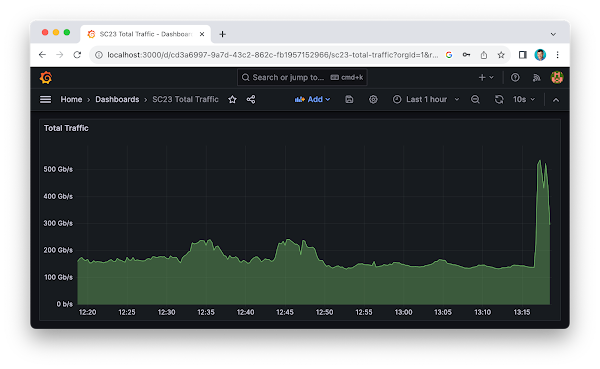
SC23 Over 6 Terabits per Second of WAN Traffic
Thursday, November 16, 2023
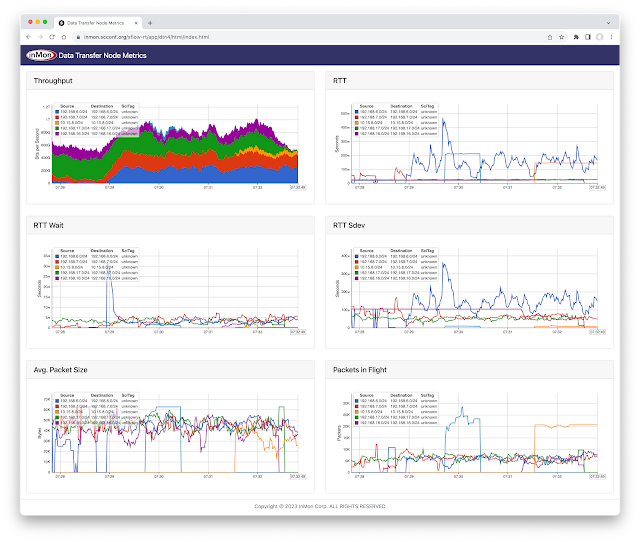
SC23 Data Transfer Node TCP Metrics
The dashboard displays data gathered from open source Host sFlow agents installed on Data Transfer Nodes (DTNs) run by the Caltech High Energy Physics Department and used for handling transfer of large scientific data sets (for example, accessing experiment data from the CERN particle accelerator). Network performance monitoring describes how the Host sFlow agents augment standard sFlow telemetry with measurements that the Linux kernel maintains as part of the normal operation of the TCP protocol stack.
The dashboard shows 5 large flows (greater than 50 Gigabits per Second). For each large flow being tracked, additional TCP performance metrics are displayed:
- RTT The round trip time observed between DTNs
- RTT Wait The amount of time that data waits on sender before it can be sent.
- RTT Sdev The standard deviation on observed RTT. This variation is a measure of jitter.
- Avg. Packet Size The average packet size used to send data.
- Packets in Flight The number of unacknowledged packets.
See Defining Flows for full range of attributes that can be used to create flow metrics.
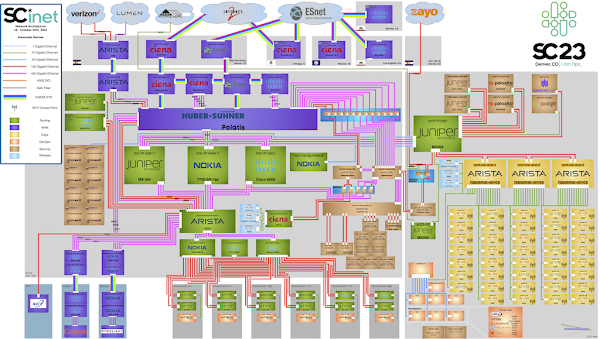
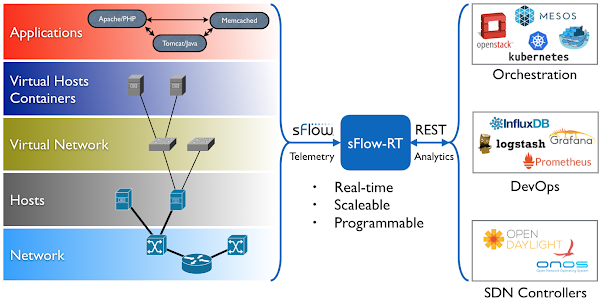
The conference network used in the demonstration, SCinet, is described as the most powerful and advanced network on Earth, connecting the SC community to the world. In this example, the sFlow-RT real-time analytics engine receives sFlow telemetry from switches, routers, and servers in the SCinet network and creates metrics to drive the real-time charts in the dashboard. Getting Started provides a quick introduction to deploying and using sFlow-RT for real-time network-wide flow analytics.Finally, check out the SC23 Dropped packet visibility demonstration, SC23 SCinet traffic, and SC23 WiFi Traffic Heatmap for additional network visibility demonstrations from the show.
Wednesday, November 15, 2023
SC23 WiFi Traffic Heatmap
Additional use cases being demonstrated this week include, SC23 Dropped packet visibility demonstration and SC23 SCinet traffic.
Monday, November 13, 2023
SC23 SCinet traffic
Finally, check out the SC23 Dropped packet visibility demonstration to learn about one of newest developments in sFlow monitoring and see a live demonstration.
Friday, November 10, 2023
SC23 Dropped packet visibility demonstration
The SC23-NRE-026 Standard Packet Drop Monitoring In High Performance Networks dashboard combines telemetry from all the Arista switches in the SCinet network to provide real-time network-wide view of performance. Each of the three charts demonstrate a different type of measurement in the sFlow telemetry stream:
- Counters: Total Traffic shows total traffic calculated from interface counters streamed from all interfaces. Counters provide a useful way of accurately reporting byte, frame, error and discard counters for each network interface. In this case, the chart rolls up data from all interfaces to trend total traffic on the network.
- Samples: Top Flows shows the top 5 largest traffic flows traversing the network. The chart is based on sFlow's random packet sampling mechanism, providing a scaleable method of determining the hosts and services responsible for the traffic reported by the counters. Visibility into top flows is essential if one wants to take action to manage network usage and capacity: immediately identifying DDoS attacks, elephant flows, and tracking changing service demands.
Note: Network addresses have been masked for privacy. - Notifications: Dropped Packets shows each dropped packet, the device that dropped it, and the reason it was dropped. Dropped packets have a profound impact on network performance and availability. Packet discards due to congestion can significantly impact application performance. Dropped packets due to black hole routes, expired TTLs, MTU mismatches, etc can result in insidious connection failures that are time consuming and difficult to diagnose.
Note: Network addresses have been masked for privacy.
sflow sampling 50000
sflow polling-interval 20
sflow vrf mgmt destination 2001:XXX:XXX:XXXX::XXX
sflow vrf mgmt source-interface Management0
sflow extension bgp
sflow run
The above Arista EOS commands enable sFlow counter polling and packet sampling on all ports, sending the sFlow telemetry to the sFlow analyzer at 2001:XXX:XXX:XXXX::XXX (IPv6 address masked for privacy).
flow tracking mirror-on-drop
  sample limit 100 pps
  !
  tracker SC23
    exporter SC23
      format sflow
      collector sflow
      local interface Management0
  no shutdown
The above commands add sFlow Dropped Packet Notification Structures to the sFlow telemetry feed. EOS 4.30.1f on Jericho 2 platforms (e.g. Arista 7804r3 at the core of SCinet diagram) is required since the implementation is based on Broadcom Mirror on Drop (MoD) instrumentation. Broadcom implements mirror-on-drop in Jericho 2, Trident 3, and Tomahawk 3, or later ASICs so it should be possible for Arista to release broad support across products incorporating these ASICs.
In this example, the sFlow-RT real-time analytics engine receives sFlow telemetry from switches, routers, and servers in the SCinet network and create metrics to drive the real-time charts in the dashboard. Getting Started provides a quick introduction to deploying and using sFlow-RT for real-time network-wide flow analytics. The demonstration dashboard only scratches the surface of the detailed visibility that is possible analyzing the packet headers exported in sFlow packet samples and dropped packet notifications - see Defining Flows.
The dashboard above trends Total Packet Rate and Dropped Packet Rate by Reason. The dashboard was constructed using the Prometheus time series database to store metrics retrieved from sFlow-RT and Grafana to build the dashboard. Deploy real-time network dashboards using Docker compose demonstrates how to deploy and configure these tools to create custom dashboards like the one shown here.
Industry standard sFlow telemetry is widely supported by data center switch vendors and provides the scaleable real-time visibility needed to understand and manage traffic in high performance networks. The open source Host sFlow agent extends visibility onto servers to ensure end-to-end visibility.
Visibility into dropped packets is essential for Artificial Intelligence/Machine Learning (AI/ML) workloads, where a single dropped packet can stall large scale computational tasks, idling millions of dollars worth of GPU/CPU resources, and delaying the completion of business critical workloads. Enable real-time sFlow telemetry to provide the observability needed to effectively manage these networks.


