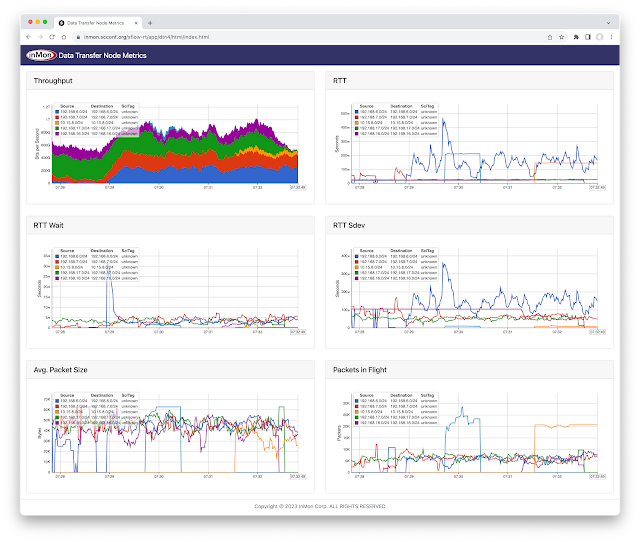
The dashboard displays data gathered from open source Host sFlow agents installed on Data Transfer Nodes (DTNs) run by the Caltech High Energy Physics Department and used for handling transfer of large scientific data sets (for example, accessing experiment data from the CERN particle accelerator). Network performance monitoring describes how the Host sFlow agents augment standard sFlow telemetry with measurements that the Linux kernel maintains as part of the normal operation of the TCP protocol stack.
The dashboard shows 5 large flows (greater than 50 Gigabits per Second). For each large flow being tracked, additional TCP performance metrics are displayed:
- RTT The round trip time observed between DTNs
- RTT Wait The amount of time that data waits on sender before it can be sent.
- RTT Sdev The standard deviation on observed RTT. This variation is a measure of jitter.
- Avg. Packet Size The average packet size used to send data.
- Packets in Flight The number of unacknowledged packets.
See Defining Flows for full range of attributes that can be used to create flow metrics.
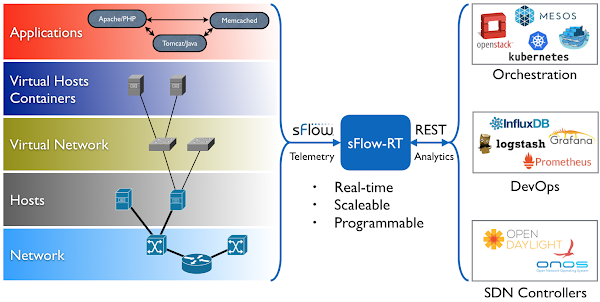
The conference network used in the demonstration, SCinet, is described as the most powerful and advanced network on Earth, connecting the SC community to the world. In this example, the sFlow-RT real-time analytics engine receives sFlow telemetry from switches, routers, and servers in the SCinet network and creates metrics to drive the real-time charts in the dashboard. Getting Started provides a quick introduction to deploying and using sFlow-RT for real-time network-wide flow analytics.Finally, check out the SC23 Dropped packet visibility demonstration, SC23 SCinet traffic, and SC23 WiFi Traffic Heatmap for additional network visibility demonstrations from the show.


No comments:
Post a Comment