Showing posts with label measurement. Show all posts

Monday, March 7, 2022

Who monitors the monitoring systems?

Adrian Cockroft poses an interesting question in, Who monitors the monitoring systems? He states, The first thing that would be useful is to have a monitoring system that has failure modes which are uncorrelated with the infrastructure it is monitoring. ... I don’t know of a specialized monitor-of-monitors product, which is one reason I wrote this blog post.

This article offers a response, describing how to introduce an uncorrelated monitor-of-monitors into the data center to provide real-time visibility that survives when the primary monitoring systems fail.

Summary of the AWS Service Event in the Northern Virginia (US-EAST-1) Region, This congestion immediately impacted the availability of real-time monitoring data for our internal operations teams, which impaired their ability to find the source of congestion and resolve it. December 10th, 2021

Standardizing on a small set of communication primitives (gRPC, Thrift, Kafka, etc.) simplifies the creation of large scale distributed services. The communication primitives abstract the physical network to provide reliable communication to support distributed services running on compute nodes. Monitoring is typically regarded as a distributed service that is part of the compute infrastructure, relying on agents on compute nodes to transmit measurements to scale out analysis, storage, automation, and presentation services.

System wide failures occur when the network abstraction fails and the limitations of the physical network infrastructure intrude into the overlaid monitoring, compute, storage, and application services. Physical network service failure is the Achilles heel of distributed compute infrastructure since the physical network is the glue that ties the infrastructure together.

However, the physical network is also a solution to the monitoring problem, providing an independent uncorrelated point of observation that has visibility into all the physical network resources and the services that run over them.
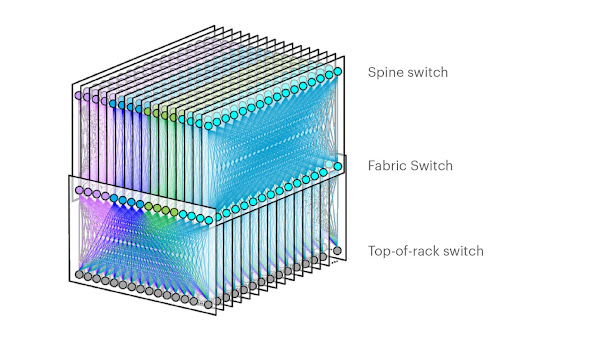
Reinventing Facebook’s data center network describes the architecture of a data center network. The network is a large distributed system made up of thousands of hardware switches and the tens of thousands of optical links that connect them. The network can route trillions of packets per second and has a capacity measured in Petabits/second.

The industry standard sFlow measurement system, implemented by all major data center network equipment vendors, is specifically designed to address the challenge of monitoring large scale switched networks. The sFlow specification embeds standard instrumentation into the hardware of each switch, making monitoring an integral part of the function of the switch, and ensuring that monitoring capacity scales out as network size increases.
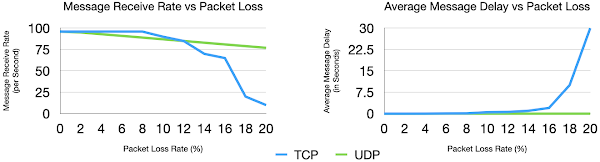
UDP vs TCP for real-time streaming telemetry describes how sFlow uses UDP to transport measurements from the network devices to the analytics software in order to maintain real-time visibility during network congestion events. The graphs from the article demonstrate that the different transport characteristics of UDP and TCP decouple the physical network monitoring system from the primary monitoring systems which typically depend on TCP services.

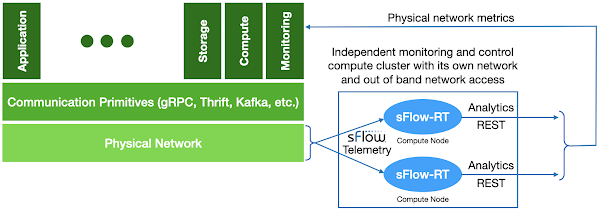
The diagram at the top of this article shows the elements of an sFlow monitoring system designed to provide independent visibility into large scale data center network infrastructure.

Each network device can be configured to send sFlow telemetry to at least two destinations. In the diagram two independent instances of the sFlow-RT real-time analytics engine are deployed on two separate compute nodes, each receiving its own stream of telemetry from all devices in the network. Since both sFlow-RT instances receive the same telemetry stream, they independently maintain copies of the network state that can be separately queried, ensuring availability in the event of a node failure.

Note: Tollerance to packet loss allows sFlow to be sent inband to reduce load on out-of-band management networks without significant loss of visibility. 

Scalability is ensured by sFlow's scale out hardware-based instrumentation. Leveraging the collective capability of the distributed instrumentation allows each sFlow-RT instance to monitor the current state of the entire data center network.

Tuning Performance describes how to optimize sFlow-RT performance for large scale monitoring.

The compute nodes hosting sFlow-RT instances should be physically separate from production compute service and have an independent network with out of band access so that measurements are available in cases were network performance issues have disrupted the production compute service.

This design is intentionally minimalist in order to reliably deliver real-time visibility during periods of extreme network congestion when all other systems fail.

In Failure Modes and Continuous Resilience, Adrian Cockroft states, The first technique is the most generally useful. Concentrate on rapid detection and response. In the end, when you’ve done everything you can do to manage failures you can think of, this is all you have left when that weird complex problem that no-one has ever seen before shows up!

With the state of the network stored in memory, each sFlow-RT instance provides an up to the second view of network performance with query response times measured in milliseconds. Queries are optimized to quickly diagnose network problems:

  • Detect network congestion
  • Identify traffic driving congestion
  • Locate control points to mitigate congestion
Real-time traffic analytics can drive automated remediation for common classes of problem to rapidly restore network service. Automated responses include:
  • Filtering out DDoS traffic
  • Shed non-essential services
  • Re-routing traffic
  • Shaping traffic
Of course, reliable control actions require an out-of-band management network so that controls can be deployed even if the production network is failing. Once physical network congestion problems have been addressed, restored monitoring services will provide visibility into production services and allow normal operations to resume. Real-time physical network visibility allows automated control actions to resolve physical network congestion problems within seconds so that there is negligible impact on the production systems.

Physical network visibility has utility beyond addressing extreme congestion events, feeding physical network flow analytics into production monitoring systems augments visibility and provides useful information for intrusion detection, capacity planning, workload placement, autoscaling, and service optimization. In addition, comparing the independently generated flow metrics profiling production services with the metrics generated by the production monitoring systems provides an early warning of  monitoring system reliability. Finally, the low latency of network flow metrics are a leading indicator of performance that can be used to improve the agility of production monitoring and control.

Getting started with sFlow is easy. Ideally, enable sFlow monitoring on the switches in a pod and install an instance of sFlow-RT to see traffic in your own environment, alternatively, Real-time telemetry from a 5 stage Clos fabric describes a lightweight emulation of realistic data center switch topologies using Docker and Containerlab that allows you to experiment with real-time sFlow telemetry and analytics before deploying into production.

Monday, February 14, 2022

UDP vs TCP for real-time streaming telemetry

This article compares UDP and TCP and their suitability for transporting real-time network telemetry. The results obtained demonstrate that poor throughput and high message latency in the face of packet loss makes TCP unsuitable for providing visibility during congestion events. We demonstrate that the use of UDP transport by the sFlow telemetry standard overcomes the limitations of TCP to deliver robust real-time visibility during extreme traffic events when visibility is most needed.
Summary of the AWS Service Event in the Northern Virginia (US-EAST-1) Region, "This congestion immediately impacted the availability of real-time monitoring data for our internal operations teams, which impaired their ability to find the source of congestion and resolve it." December 10th, 2021

The data in these charts was created using Mininet to simulate packet loss in a simple network. If you are interested in replicating these results, Multipass describes how to run Mininet on your laptop.

sudo mn --link tc,loss=5

For example, the above command simulates a simple network consisting of two hosts connected by a switch. A packet loss rate of 5% is configured for each link.

Simple Python scripts running on the simulated hosts were used to simulate transfer of network telemetry.

#!/usr/bin/env python3

import socket
import time
import sys
import struct

HOST = '10.0.0.1'
PORT = 65432

buf = bytearray(1000)
with socket.socket(socket.AF_INET, socket.SOCK_STREAM) as s:
  s.connect((HOST, PORT))
  while True:
    now = time.time()
    buf[0:8] = struct.pack('>d',now)
    s.sendall(buf)
    time.sleep(0.01)

The above sender.py script builds a 1000 byte timestamped message, sends the message, and sleeps for 0.01 seconds, and repeats the steps in a continuous loop. This level of message traffic is typical of what you might see from an sFlow agent embedded in a datacenter switch on a moderately busy network.

#!/usr/bin/env python3

import socket
import time
import struct

HOST = '10.0.0.1'
PORT = 65432 

def recv_msg(sock,n):
  data = bytearray()
  while len(data) < n:
    packet = sock.recv(n - len(data))
    if not packet:
      return None
    data.extend(packet)
  return data

with socket.socket(socket.AF_INET, socket.SOCK_STREAM) as s:
  s.bind((HOST, PORT))
  s.listen()
  conn, addr = s.accept()
  with conn:
    while True:
      data = recv_msg(conn,1000)
      if not data:
        break
      time_sent = struct.unpack('>d',data[0:8])[0]
      time_now = time.time()
      print("%f %f" % (time_now,time_now - time_sent), flush=True)

The above receiver.py script accepts a connection from the sender, reads messages, and computes latency using the encoded sender timestamp.

The average delay is a constant 160 µS for UDP. TCP message delay exceeds 1 second average at 14% packet loss and averages 30 seconds at 20% packet loss.


The maximum measurement delay chart tells a dire story. While UDP never sees a message delay greater than 8 mS, maximum TCP message delay reaches 14 minutes at 20% packet loss!

Both TCP and UDP achieve 96 messages per second throughput at 0% packet loss. UDP throughput declines linearly with packet loss as one would expect, dropping to 77 messages per second at 20% packet loss. The throughput of TCP stays at 96 message per second until the packet loss rate reaches 10%, where it drops to 90 messages per second. At a packet loss of 12% the throughput of TCP / UDP is equal at 85 messages per second. TCP throughput drops off rapidly and falls to 10 messages per second at 20% packet loss.

The results demonstrate that TCP based telemetry fails to provide adequate visibility in the face of packet loss, with a steep drop in throughput and a dramatic increase in delay that makes the measurements useless for real-time troubleshooting and automated control. UDP based telemetry on the other hand provides consistently low message delay and maintains high throughput at the cost of moderate message loss.

The sFlow standard is designed for use with UDP, specifying measurements that degrade gracefully in the presence of expected packet loss:

  1. Monotonic Counters For example, the total number of packets and bytes sent and received on an interface are sent, leaving it up to the sFlow analyzer to compute packet rates and interface utilizations. If a message is lost there is no need for it to be retransmitted since the next message will contain the current value of the counter.
  2. Packet samples sFlow's packet sampling mechanism treats record loss as a decrease in the sampling probability. The sFlow records contain information that allows the traffic analyzer to measure the effective sampling rate, compensate for the packet loss, and generate corrected values. Each sFlow record represents a single packet event and large flows of traffic will generate a number of sFlow records. Thus, the loss of an sFlow record does not represent a significant loss of data and doesn't affect the overall accuracy of traffic measurements.

In addition, recent extensions to the sFlow protocol enhance visibility into sources of delay and packet loss in the network, see: Transit delay and queueing and Real-time trending of dropped packets. As we have demonstrated, services running in the datacenter that rely on TCP will be severely impacted by packet loss and so the ability to monitor and control packet loss is essential for maintaining service levels.

The following articles discuss how sFlow relates to, and complements, emerging telemetry standards:

Deploying an sFlow monitoring solution is straightforward since sFlow is widely implemented in datacenter equipment from vendors including: A10, Arista, Aruba, Cisco, Edge-Core, Extreme, Huawei, Juniper, NEC, Netgear, Nokia, NVIDIA, Quanta, and ZTE. In addition, the open source Host sFlow agent makes it easy to extend visibility beyond the physical network into the compute infrastructure.

The diagram shows the high level architecture for real-time datacenter-wide sFlow analytics. Telemetry continuously streams from all network, host and application instances to a central analyzer which constructs a real-time view of performance, identifying hot spots, and driving automated remediation. In this case the sFlow-RT analytics engine continuously monitors tens of thousands of industry standard sFlow telemetry sources and responds within a seconds to performance challenges.

Finally, a couple of popular use cases give an idea of the solutions that can be built on sFlow real-time telemetry.

DDoS protection quickstart guide describes how to deploy sFlow along with BGP RTBH/Flowspec to automatically detect and mitigate DDoS flood attacks. The use of sFlow provides sub-second visibility into network traffic during the periods of high packet loss experienced during a DDoS attack. The result is a system that can reliably detect and respond to attacks in real-time.

Flow metrics with Prometheus and Grafana describes how to import user defined flow metrics into the Prometheus time series data base and build real-time dashboards using Grafana. Here gain, reliable, low latency measurements during periods of packet loss ensure that operators have the information needed to find the root cause and quickly respond.

Monday, March 22, 2021

In-band Network Telemetry (INT)

The recent addition of in-band streaming telemetry (INT) measurements to the sFlow industry standard simplifies deployment by addressing the operational challenges of in-band monitoring.

The diagram shows the basic elements of In-band Network Telemetry (INT) in which the ingress switch is programmed to insert a header containing measurements to packets entering the network. Each switch in the path is programmed to append additional measurements to the packet header. The egress switch is programmed to remove the header so that the packet can be delivered to its destination. The egress switch is responsible for processing the measurements or sending them on to analytics software.

There are currently two competing specifications for in-band telemetry:

  1. In-band Network Telemetry (INT) Dataplane Specification
  2. Data Fields for In-situ OAM

Common telemetry attributes from both standards include:

  1. node id
  2. ingress port
  3. egress port
  4. transit delay (egress timestamp - ingress timestamp)
  5. queue depth

Visibility into network forwarding performance is very useful, however, there are practical issues that should be considered with the in-band telemetry approach for collecting the measurements:

  1. Transporting measurement headers is complex with different encapsulations for each transport protocol:  Geneve, VxLAN, GRE, UDP, TCP etc.
  2. Addition of headers increases the size of packets and risks causing traffic to be dropped downstream due to maximum transmission unit (MTU) restrictions.
  3. The number of measurements that can be added by each switch and the number of switches adding measurements in the path needs to be limited.
  4. In-band telemetry cannot be incrementally deployed. Ideally, all devices need to participate, or at a minimum, the ingress and egress devices need to be in-band telemetry aware.
  5. In-band telemetry transports data from the data plane to the control/management planes, providing a potential attack surface that could be exploited by crafting malicious packets with fake measurement headers.
  6. There is no standard mechanism for transporting measurements from the egress switch for analysis.
  7. There is no data model to link in-band telemetry to other sources of data (NETCONF, SNMP, etc.)

The sFlow Transit Delay Structures extension addresses these issues by defining how the in-band network telemetry attributes can be exported in real-time using the industry standard sFlow protocol.

The sFlow architecture, shown at the top of this article, provides an out of band alternative for transporting the per packet forwarding plane measurements. The switch ASIC attaches performance measurements as metadata to sampled packets sent to the sFlow Agent instead of adding the measurements to the egress packet. The sFlow Agent immediately forwards the additional packet metadata as part of the standard sFlow telemetry stream to a central sFlow analyzer. The sFlow Analyzer provides a real-time view of the performance of the entire network.

Using sFlow as the telemetry transport has a number of benefits:

  1. Simple to deploy since there is no modification of packets (no issues with encapsulations, MTU, number of measurements, path length, incremental deployment, etc.)
  2. Extensibility of sFlow protocol allows additional forwarding plane measurements to augment existing sFlow measurements, fully integrating the new measurements with sFlow data exported from other switches in the network (Arista, Aruba, Cisco, Dell, Huawei, Juniper, etc.)
  3. sFlow's is a unidirectional telemetry transport protocol originates from the device management plane, can be sent out of band, limiting possible attack surfaces.
  4. Measurements are delivered in real-time directly to the sFlow Analyzer.
  5. sFlow data model links telemetry to external data (SNMP, NETCONF, OpenConfig, etc.)

Transit delay and queueing describes the new sFlow measurements in more detail and demonstrates a working implementation. The instrumentation to support these measurements is widely available in current generation network ASICs. If you are interested in visibility into network performance, ask your network vendor about their plans to implement the sFlow Transit Delay Structures extension.

Wednesday, March 17, 2021

Transit delay and queueing


The recently finalized sFlow Transit Delay Structures extension provides visibility into the performance of packet forwarding in a switch or router using the industry standard sFlow protocol.

The diagram provides a logical representation of packet forwarding. A packet is received at an Ingress Port, the packet header is examined and a forwarding decision is made to add the packet to one of the queues associated with an Egress Port, finally the packet is removed from the queue and sent out the Egress Port to be received by the next device in the chain.

The time between sending and receiving a packet is the packet's transit delay. The transit delay is affected by the time it takes to make the forwarding decision and the time the packet spends in the queue. Identifying the specific queue selected and the number of bytes already in the queue fills out the set of performance metrics for the forwarding decision. The sFlow Transit Delay Structures extension adds these performance metrics to the metadata associated with each packet sample. 

The following output from sflowtool shows that data contained in a packet sample:

startSample ----------------------
sampleType_tag 0:1
sampleType FLOWSAMPLE
sampleSequenceNo 91159
sourceId 0:2216
meanSkipCount 400
samplePool 36463600
dropEvents 0
inputPort 2215
outputPort 2216
flowBlock_tag 0:1036
extendedType egress_queue
egress_queue_id 7
flowBlock_tag 0:1040
extendedType queue_depth
queue_depth_bytes 11354112
flowBlock_tag 0:1039
extendedType transit_delay
transit_delay_nS 839660224
flowBlock_tag 0:1
flowSampleType HEADER
headerProtocol 1
sampledPacketSize 1446
strippedBytes 4
headerLen 128
headerBytes 98-03-9B-8F-B5-CC-98-03-9B-94-C7-D5-08-00-45-16-05-94-12-C7-00-00-FE-11-B8-43-C0-00-02-02-C6-33-64-02-30-39-D4-31-05-80-D7-1D-42-42-42-42-42-42-42-42-42-42-42-42-42-42-42-42-42-42-42-42-42-42-42-42-42-42-42-42-42-42-42-42-42-42-42-42-42-42-42-42-42-42-42-42-42-42-42-42-42-42-42-42-42-42-42-42-42-42-42-42-42-42-42-42-42-42-42-42-42-42-42-42-42-42-42-42-42-42-42-42-42-42-42-42-42-42
dstMAC 98039b8fb5cc
srcMAC 98039b94c7d5
IPSize 1428
ip.tot_len 1428
srcIP 192.0.2.2
dstIP 198.51.100.2
IPProtocol 17
IPTOS 22
IPTTL 254
IPID 50962
UDPSrcPort 12345
UDPDstPort 54321
UDPBytes 1408
endSample   ----------------------

The forwarding performance information is highlighted. The inputPort, outputPort, egress_queue_id, queue_depth_bytes, and transit_delay_nS values describe the performance observed by the sampled packet. The sampled packet header allows performance to be reported by specific hosts, protocols, ports, connections, etc.

Linux 4.11 kernel extends packet sampling support describes the Linux PSAMPLE interface used by the Host sFlow agent to receive packet samples. PSAMPLE has been extended in the Linux 5.13 kernel to add the performance metrics, PSAMPLE_ATTR_OUT_TC (egress queue), PSAMPLE_ATTR_OUT_TC_OCC (egress queue depth), and PSAMPLE_ATTR_LATENCY (transit delay) needed to populate the sFlow Transit Delay Structures and the Host sFlow agent now exports the performance data when it is available. The decoded sFlow record, above, was generated by Host sFlow running on a hardware switch and shows measurements made by the switch ASIC.

PSAMPLE and the Host sFlow agent are becoming the standard for sFlow monitoring of Linux based operating systems such as Cumulus Linux, DENT, and SONiC.  As ASIC vendors include the measurements in their device driver PSAMPLE support, they will automatically be included in the sFlow telemetry.

Support for the new extensions has also been added to the sFlow-RT real-time analytics engine. The open source sFlow-RT Flow Browser application shown in the screen shot above displays a real-time, up to the second, view of traffic based on the packet sample telemetry streaming from network devices (switches, routers, and hosts).

In the chart above, the value being plotted has been changed from Bits per Second and is now displaying flows with the highest transit delay (in nanoseconds). The specific device, ingress port, egress port, and egress queue are also identified. 

In the chart above, queue depth (in bytes) is displayed, showing that the nearly 12 Mbytes queue depth is responsible for the transit delay seen in the previous chart.

If the queue is full and the packet is dropped, the sFlow Dropped Packet Notification Structures extension allows the sFlow agent to report details of the dropped packet. Using sFlow to monitor dropped packets describes how the Host sFlow agent uses the Linux drop_monitor interface to implement the extension.

In the final chart above, the open source sFlow-RT Discard Browser application displays a sequence of packets being dropped by a switch as a host attempts, and fails, to establish a TCP connection. The reason for dropping the packets (an access control list) as well as device and ingress port where the packets were dropped are captured.

Transit delay and dropped packet monitoring leverage advanced instrumentation in the latest generation of network ASICs to provide valuable insight into network performance. Integration with industry standard streaming sFlow telemetry provides real-time network-wide visibility into traffic, performance, and errors.

Thursday, March 22, 2018

OCP Summit 2018

Network telemetry was a popular topic at the recent OCP U.S. Summit 2018 in San Jose, California, with an entire afternoon track of the two day conference devoted to the subject. Videos of the talks should soon be posted on the conference web site.

The following articles on this blog cover related topics:
In addition, there were a couple of live sFlow telemetry demonstration in the conference exhibit hall.
The first was a demonstration of leaf and spine fabric visibility using white box switches running the open source Linux Foundation OpenSwitch network operating system. OpenSwitch describes how the open source Host sFlow agent enables standard sFlow instrumentation in merchant silicon based white box switches using OpenSwitch Control Plane Services (CPS), which in turn programs the silicon using the OCP Switch Abstraction Interface (SAI).

The rack in the booth contains a two spine, five leaf network. Each of the switches in the network is streaming real-time sFlow telemetry to an instance of Fabric View which is displaying real-time (up to the second) flow analytics on the monitor to the right of the picture.
The second demonstration shows a Marvell top of rack (ToR) switch with an ARM based management CPU running Linux, DPDK and SONiC. In this example, the switch is streaming sFlow telemetry to a free version of sFlowTrend which is displaying top flows in the trend chart.

Monday, March 19, 2018

Prometheus and Grafana

Prometheus is an open source time series database optimized to collect large numbers of metrics from cloud infrastructure. This article will explore how industry standard sFlow telemetry streaming supported by network devices and Host sFlow agents (Linux, Windows, FreeBSD, AIX, Solaris, Docker, Systemd, Hyper-V, KVM, Nutanix AHV, Xen) can be integrated with Prometheus.

The diagram above shows the elements of the solution: sFlow telemetry streams from hosts and switches to an instance of sFlow-RT. The sFlow-RT analytics software converts the raw measurements into metrics that are accessible through a REST API.

The following prometheus.php script mediates between the Prometheus metrics export protocol and the sFlow-RT REST API.  HTTP queries from Prometheus are translated into calls to the sFlow-RT REST API and JSON responses are converted into Prometheus metrics.
<?php
header('Content-Type: text/plain');
if(isset($_GET['labels'])) {
  $keys = htmlspecialchars($_GET["labels"]);
}
$vals = htmlspecialchars($_GET["values"]);
if(isset($keys)) {
  $cols = $keys.','.$vals;
} else {
  $cols = $vals;
}
$key_arr = explode(",",$keys);
$result = file_get_contents('http://localhost:8008/table/ALL/'.$cols.'/json');
$obj = json_decode($result,true);
foreach ($obj as $row) {
  unset($labels);
  foreach ($row as $cell) {
    if(!isset($labels)) {
      $labels = 'agent="'.$cell['agent'].'",datasource="'.$cell['dataSource'].'"';
    }
    $name = $cell['metricName'];
    $val = $cell['metricValue'];
    if(in_array($name,$key_arr)) {
      $labels .= ','.$name.'="'.$val.'"';
    } else {
      print $name."{".$labels."} ".$val."\n";
    }
  }
}
?>
Install prometheus.php under the web server home directory (e.g. /var/www/html) on the system running sFlow-RT and verify functionality using cURL:
$ curl "http://localhost/prometheus.php?labels=host_name&values=load_one"
load_one{agent="10.0.0.86",datasource="2.1",host_name="server3"} 0.06
load_one{agent="10.0.0.85",datasource="2.1",host_name="server2"} 0
load_one{agent="10.0.0.82",datasource="2.1",host_name="spine1"} 0
load_one{agent="10.0.0.83",datasource="2.1",host_name="spine2"} 0
load_one{agent="10.0.0.80",datasource="2.1",host_name="leaf1"} 0
load_one{agent="10.0.0.81",datasource="2.1",host_name="leaf2"} 0
Define metrics "scraping" jobs in the Prometheus configuration file, prometheus.yml. In this example sFlow-RT is running on host 10.0.0.162 and two sets of metrics have been defined using prometheus.php interface. The sflow-rt-hosts job retrieves host metrics labeled by host_name and the sflow-rt-ifstats job retrieves network interface metrics labeled by host_name and ifname. The metric values in this example are a small selection from the extensive set of standard sFlow metrics available from sFlow-RT, see Metrics.
global:
  scrape_interval:     15s
  evaluation_interval: 15s

rule_files:
  # - "first.rules"
  # - "second.rules"

scrape_configs:
  - job_name: 'sflow-rt-hosts'
    scrape_interval: 30s
    metrics_path: /prometheus.php
    params:
      labels: ['host_name']
      values: ['load_one,cpu_utilization,proc_run']
    static_configs:
      - targets: ['10.0.0.162']
  - job_name: 'sflow-rt-ifstats'
    scrape_interval: 30s
    metrics_path: /prometheus.php
    params:
      labels: ['host_name,ifname']
      values: ['ifinutilization,ifoututilization,ifindiscards,ifoutdiscards']
    static_configs:
      - targets: ['10.0.0.162']
Start Prometheus. For example, the following command shows how to run Prometheus under Docker:
docker run --name prometheus --rm -v $PWD/data:/prometheus \
-v $PWD/prometheus.yml:/etc/prometheus/prometheus.yml \
-p 9090:9090 prom/prometheus
The screen capture above shows the Prometheus web interface, accessible on port 9090.
Grafana is open source time series analysis software. The ability to pull data from many data sources and the extensive range of charting options makes Grafana an attractive tool for building operations dashboards.

The following command shows how to run Grafana under Docker:
docker run --name grafana --rm -v $PWD/data:/var/lib/grafana \
-p 3000:3000 grafana/grafana
Access the Grafana web interface on port 3000, configure a data source for the Prometheus database, and start building dashboards. The screen capture above shows the same chart built earlier using the native Prometheus interface.

Standard sFlow telemetry provides a unified method of monitoring large scale network and compute infrastructure. This example focussed on sFlow counter metrics, but sFlow also provides real-time flow information that can be used to generate flow metrics, for example, reporting on interactions between microservices.

Additional examples on this blog include:

Monday, October 10, 2016

Collecting Docker Swarm service metrics

This article demonstrates how to address the challenge of monitoring dynamic Docker Swarm deployments and track service performance metrics using existing on-premises and cloud monitoring tools like Ganglia, Graphite, InfluxDB, Grafana, SignalFX, Librato, etc.

In this example, Docker Swarm is used to deploy a simple web service on a four node cluster:
docker service create --replicas 2 -p 80:80 --name apache httpd:2.4
Next, the following script tests the agility of monitoring systems by constantly changing the number of replicas in the service:
#!/bin/bash
while true
do
  docker service scale apache=$(( ( RANDOM % 20 )  + 1 ))
  sleep 30
done
The above test is easy to set up and is a quick way to stress test monitoring systems and reveal accuracy and performance problems when they are confronted with container workloads.

Many approaches to gathering and recording metrics were developed for static environments and have a great deal of difficulty tracking rapidly changing container-based service pools without missing information, leaking resources, and slowing down. For example, each new container in Docker Swarm has unique name, e.g. apache.16.17w67u9157wlri7trd854x6q0. Monitoring solutions that record container names, or even worse, index data by container name, will suffer from bloated databases and resulting slow queries.

The solution is to insert a stream processing analytics stage in the metrics pipeline that delivers a consistent set of service level metrics to existing tools.
The asynchronous metrics export method implemented in the open source Host sFlow agent is part of the solution, sending a real-time telemetry stream to a centralized sFlow collector which is then able to deliver a comprehensive view of all services deployed on the Docker Swarm cluster.

The sFlow-RT real-time analytics engine completes the solution by converting the detailed per instance metrics into service level statistics which are in turn streamed to a time series database where they drive operational dashboards.

For example, the following swarmmetrics.js script computes cluster and service level metrics and exports them to InfluxDB:
var docker = "https://10.0.0.134:2376/services";
var certs = '/tls/';

var influxdb = "http://10.0.0.50:8086/write?db=docker"

var clustermetrics = [
  'avg:load_one',
  'max:cpu_steal',
  'sum:node_domains'
];

var servicemetrics = [
  'avg:vir_cpu_utilization',
  'avg:vir_bytes_in',
  'avg:vir_bytes_out'
];

function sendToInfluxDB(msg) {
  if(!msg || !msg.length) return;

  var req = {
    url:influxdb,
    operation:'POST',
    headers:{"Content-Type":"text/plain"},
    body:msg.join('\n')
  };
  req.error = function(e) {
    logWarning('InfluxDB POST failed, error=' + e);
  }
  try { httpAsync(req); }
  catch(e) {
    logWarning('bad request ' + req.url + ' ' + e);
  }
}

function clusterMetrics(nservices) {
  var vals = metric(
    'ALL', clustermetrics,
    {'node_domains':['*'],'host_name':['vx*host*']}
  );
  var msg = [];
  msg.push('swarm.services value='+nservices);
  msg.push('nodes value='+(vals[0].metricN || 0));
  for(var i = 0; i < vals.length; i++) {
    let val = vals[i];
    msg.push(val.metricName+' value='+ (val.metricValue || 0));
  } 
  sendToInfluxDB(msg);
}

function serviceMetrics(name, replicas) {
  var vals = metric(
    'ALL', servicemetrics,
    {'vir_host_name':[name+'\\.*'],'vir_cpu_state':['running']}
  );
  var msg = [];
  msg.push('replicas_configured,service='+name+' value='+replicas);
  msg.push('replicas_measured,service='+name+' value='+(vals[0].metricN || 0));
  for(var i = 0; i < vals.length; i++) {
    let val = vals[i];
    msg.push(val.metricName+',service='+name+' value='+(val.metricValue || 0));
  }
  sendToInfluxDB(msg);
}

setIntervalHandler(function() {
  var i, services, service, spec, name, replicas, res;
  try { services = JSON.parse(http2({url:docker, certs:certs}).body); }
  catch(e) { logWarning("cannot get " + docker + " error=" + e); }
  if(!services || !services.length) return;

  clusterMetrics(services.length);

  for(i = 0; i < services.length; i++) {
    service = services[i];
    if(!service) continue;
    spec = service["Spec"];
    if(!spec) continue;
    name = spec["Name"];
    if(!name) continue;
 
    replicas = spec["Mode"]["Replicated"]["Replicas"];
    serviceMetrics(name, replicas);
  }
},10);
Some notes on the script:
  1. Only a few representative metrics are being monitored, many more are available, see Metrics.
  2. The setIntervalHandler function is run every 10 seconds. The function queries Docker REST API for the current list of services and then calculates summary statistics for each service. The summary statistics are then pushed to InfluxDB via a REST API call.
  3. Cluster performance metrics describes the set of summary statistics that can be calculated.
  4. Writing Applications provides additional information on sFlow-RT scripting and REST APIs.
Start gathering metrics:
docker run -v `pwd`/tls:/tls -v `pwd`/swarmmetrics.js:/sflow-rt/swarmmetrics.js \
-e "RTPROP=-Dscript.file=swarmmetrics.js" \
-p 8008:8008 -p 6343:6343/udp sflow/sflow-rt
The results are shown in the Grafana dashboard at the top of this article. The charts show 30 minutes of data. The top Replicas by Service chart compares the number of replicas configured for each service with the number of container instances that the monitoring system is tracking. The chart demonstrates that the monitoring system is accurately tracking the rapidly changing service pool and able to deliver reliable metrics. The middle Network IO by Service chart shows a brief spike in network activity whenever the number of instances in the apache service is increased. Finally, the bottom Cluster Size chart confirms that all four nodes in the Swarm cluster are being monitored.

This solution is extremely scaleable. For example, increasing the size of the cluster from 4 to 1,000 nodes increases the amount of raw data that sFlow-RT needs to process to accurately calculate service metrics, but has have no effect on the amount of data sent to the time series database and so there is no increase in storage requirements or query response time.
Pre-processing the stream of raw data reduces the cost of the monitoring solution, either in terms of the resources required by an on-premises monitoring solutions, or the direct costs of cloud based solutions which charge per data point per minute per month. In this case the raw telemetry stream contains hundreds of thousands of potential data points per minute per host - filtering and summarizing the data reduces monitoring costs by many orders of magnitude.
This example can easily be modified to send data into any on-premises or cloud based backend, examples in this blog include: SignalFX, Librato, Graphite and Ganglia. In addition, Docker 1.12 swarm mode elastic load balancing describes how the same architecture can be used to dynamically resize service pools to meet changing demand.

Wednesday, June 15, 2016

Programmable hardware: Barefoot Networks, PISA, and P4

Barefoot Networks recently came out of stealth to reveal their  Tofino 6.5Tbit/second (65 X 100GE or 260 X 25GE) fully user-programmable switch. The diagram above, from the talk Programming The Network Data Plane by Changhoon Kim of Barefoot Networks, shows the Protocol Independent Switch Architecture (PISA) of the programmable switch silicon.
A logical switch data-plane described in the P4 language is compiled to program the general purpose PISA hardware. For example, the following P4 code snippet is part of a P4 sFlow implementation:
table sflow_ing_take_sample {
    /* take_sample > MAX_VAL_31 and valid sflow_session_id => take the sample */
    reads {
        ingress_metadata.sflow_take_sample : ternary;
        sflow_metadata.sflow_session_id : exact;
    }
    actions {
        nop;
        sflow_ing_pkt_to_cpu;
    }
}
Network visibility is one of the major use cases for P4 based switches. Improving Network Monitoring and Management with Programmable Data Planes describes how P4 can be used to collect information about latency and queueing in the switch forwarding pipeline.
The document also describes an architecture for In-band Network Telemetry (INT) in which the ingress switch is programmed to insert a header containing measurements to packets entering the network. Each switch in the path is programmed to append additional measurements to the packet header. The egress switch is programmed to remove the header so that the packet can be delivered to its destination. The egress switch is responsible for processing the measurements or sending them on to analytics software.

In-band telemetry is an interesting example of the flexibility provided by P4 programmable hardware and the detailed information that can be gathered about latency and queueing from the hardware forwarding pipeline. However, there are practical issues that should be considered with this approach:
  1. Transporting measurement headers is complex with different encapsulations for each transport protocol:  Geneve, VxLAN, etc.
  2. Addition of headers increases the size of packets and risks causing traffic to be dropped downstream due to maximum transmission unit (MTU) restrictions.
  3. The number of measurements that can be added by each switch and the number of switches adding measurements in the path needs to be limited.
  4. In-band telemetry cannot be incrementally deployed. Ideally, all devices need to participate, or at a minimum, the ingress and egress devices need to be in-band telemetry aware.
  5. In-band telemetry transports data from the data plane to the control/management planes, providing a potential attack surface that could be exploited by crafting malicious packets with fake measurement headers.
The sFlow architecture provides an out of band alternative for transporting the per packet forwarding plane measurements defined by INT. Instead of adding the measurements to the egress packet, measurements can be attached as metadata to the sampled packets that are handed to the switch CPU. The sFlow agent immediately forwards the additional packet metadata as part of the standard sFlow telemetry stream to a centralized collector. Using sFlow as the telemetry transport has a number of benefits:
  1. Simple to deploy since there is no modification of packets (no issues with encapsulations, MTU, number of measurements, path length, incremental deployment, etc.)
  2. Extensibility of sFlow protocol allows additional forwarding plane measurements to augment standard sFlow measurements, fully integrating the new measurements with sFlow data exported from other switches in the network (sFlow is supported by over 40 switch vendors and is a standard feature of switch ASICs).
  3. sFlow's is a unidirectional telemetry transport protocol originates from the device management plane, can be sent out of band, limiting possible attack surfaces.
The great thing about programmable hardware is that behavior can be modified by changing the software. Implementing out of band telemetry is a matter of combining measurements from the P4 INT code with the P4 sFlow agent code. Compiling and installing out of band sFlow telemetry code reprograms the hardware to implement the new scheme.

The advent of P4 and programmable hardware opens up exciting possibilities for defining additional packet sample metadata, counters, and gauges to augment the sFlow telemetry stream and gain additional insight into the performance of production traffic in large scale, high capacity, networks.

The real-time sFlow streaming telemetry can be used to drive automated controls, for example, to block DDoS attacks, or load balance large "Elephant" flows across multiple paths. Here again P4 combined with programmable hardware makes it possible to create additional control capabilities, for example, to be able to block the large numbers of source addresses involved in a DDoS attack, where sFlow analytics would be used to identify the attackers and their points of ingress and program each of the switches with filters based on their location in the network. The ability to customize the hardware to address specific tasks makes more efficient use of hardware resources than is possible with fixed function device. In this case, defining a specialized DDoS drop table would allow for a much larger number of filters than would be possible with a general purpose ACL table.

Friday, June 3, 2016

Internet of Things (IoT) telemetry

The internet of things (IoT) is the network of physical objects—devices, vehicles, buildings and other items—embedded with electronics, software, sensors, and network connectivity that enables these objects to collect and exchange data. - ITU

The recently released Raspberry Pi Zero (costing $5) is an example of the type of embedded low power computer enabling IoT. These small devices are typically wired to one or more sensors (measuring temperature, humidity, location, acceleration, etc.) and embedded in or attached to physical devices.

Collecting real-time telemetry from large numbers of small devices that may be located within many widely dispersed administrative domains poses a number of challenges, for example:
  • Discovery - How are newly connected devices discovered?
  • Configuration - How can the numerous individual devices be efficiently configured?
  • Transport - How efficiently are measurements transported and delivered?
  • Latency - How long does it take before measurements are remotely accessible? 
This article will use the Raspberry Pi as an example to explore how the architecture of the industry standard sFlow protocol and its implementation in the open source Host sFlow agent provide a method of addressing the challenges of embedded device monitoring.

The following steps describe how to install the Host sFlow agent on Raspbian Jesse (the Debian Linux based Raspberry Pi operating system).
sudo apt-get update
sudo apt-get install libpcap-dev
git clone https://github.com/sflow/host-sflow
sudo make install
The resulting Host sFlow binary is extremely small (only 163,300 bytes in this case):
pi@raspberrypi:~ $ ls -l /usr/sbin/hsflowd 
-rwx------ 1 root root 163300 Jun  1 17:18 /usr/sbin/hsflowd
Next, specify /etc/hsflowd.conf file for the device:
sflow {
  agent = eth0
  agent.cidr=::/0
  DNSSD = on
  DNSSD_domain = .sf.inmon.com
  jsonPort = 36343
  pcap { dev = eth0 }
}
There are a number of important points to note about this configuration:
  • The configuration is not device specific - this same configuration can be pre-loaded in every device.
  • Prefer IPv6 addresses as a way of identifying the agent since they are more likely to be globally unique.
  • DNS Service Discovery (DNS-SD) is used to retrieve dynamic configuration on startup and to periodically refresh the configuration. Hosting a single copy of the configuration (in the form of SRV and TXT records on the DNS server responsible for the sf.inmon.com domain) minimize the complexity of managing large numbers of devices.
  • Network visibility provides a way to monitor the interactions between the devices on the network. The pcap entry enables a Berkeley Packet Filter to efficiently sample network traffic using instrumentation built into the Linux kernel.
  • Custom Metrics can be be sent along with the extensive set of standard sFlow metrics by including the jsonPort entry.
Now start the daemon:
sudo /etc/init.d/hsflowd start
Now add an entry to the sf.inmon.com.zone file on the DNS server:
_sflow._udp   30  SRV     0 0 6343  collector.sf.inmon.com.
In this case, the SRV record specifies that sFlow records should be sent via UDP to collector.sf.inmon.com on port 6343. The TTL is set to 30 seconds so that agents will pick up any changes within 30 seconds. A larger TTL should be used to improve scaleability if there are large numbers of devices.

The following example shows how Custom Metrics can be used to export sensor data. The temp.py script exports the CPU temperature:
#!/usr/bin/env python

import json
import socket

tempC = int(open('/sys/class/thermal/thermal_zone0/temp').read()) / 1e3
msg = {
  "rtmetric": {
    "datasource": "sensors",
    "tempC": { "type": "gaugeFloat", "value": tempC }
  }
}
sock = socket.socket(socket.AF_INET,socket.SOCK_DGRAM)
sock.sendto(json.dumps(msg),("127.0.0.1",36343))
The following crontab entry runs the script every minute:
* * * * * /home/pi/temp.py
The Host sFlow agent will automatically pick up the configuration via a DNS request, start making measurements, which are immediately send in standard sFlow UDP datagrams to the designated sFlow collector collector.sf.inmon.com. sFlow's immediate transmission of measurements minimizes the memory requirements on the agent (since data doesn't have to be stored for later retrieval) and minimizes the latency before measurements are accessible on the collector (and can be acted on).

It should also be noted that all communication is initiated by the device (DNS requests and transmission of telemetry via sFlow). This means that the radio on the device can be powered down between transmissions to save power (and extend battery life if the device is battery powered).
Raspberry Pi real-time network analytics describes how to build a low cost sFlow analyzer using a Raspberry Pi model 3 b and sFlow-RT real-time analytics software. The following command queries the sFlow-RT REST API to show the set of standard metrics being exported by the agent (2001:470:67:27d:d811:aa7e:9e54:30e9):
pi@raspberrypi:~ $ curl http://localhost:8008/metric/2001:470:67:27d:d811:aa7e:9e54:30e9/json
{
 "2.1.bytes_in": 3211.5520193372945,
 "2.1.bytes_out": 462.2822036458858,
 "2.1.bytes_read": 0,
 "2.1.bytes_written": 4537.818511431161,
 "2.1.contexts": 7006.546480008057,
 "2.1.cpu_guest": 0,
 "2.1.cpu_guest_nice": 0,
 "2.1.cpu_idle": 99.17638114546376,
 "2.1.cpu_intr": 0,
 "2.1.cpu_nice": 0,
 "2.1.cpu_num": 4,
 "2.1.cpu_sintr": 0.025342118601115054,
 "2.1.cpu_speed": 0,
 "2.1.cpu_steal": 0,
 "2.1.cpu_system": 0.456158134820071,
 "2.1.cpu_user": 0.3294475418144957,
 "2.1.cpu_utilization": 0.8236188545362393,
 "2.1.cpu_wio": 0.012671059300557527,
 "2.1.disk_free": 24435570688,
 "2.1.disk_total": 29627484160,
 "2.1.disk_utilization": 17.523977160453796,
 "2.1.drops_in": 0,
 "2.1.drops_out": 0,
 "2.1.errs_in": 0,
 "2.1.errs_out": 0,
 "2.1.host_name": "raspberrypi",
 "2.1.icmp_inaddrmaskreps": 0,
 "2.1.icmp_inaddrmasks": 0,
 "2.1.icmp_indestunreachs": 0,
 "2.1.icmp_inechoreps": 0,
 "2.1.icmp_inechos": 0,
 "2.1.icmp_inerrors": 0,
 "2.1.icmp_inmsgs": 0,
 "2.1.icmp_inparamprobs": 0,
 "2.1.icmp_inredirects": 0,
 "2.1.icmp_insrcquenchs": 0,
 "2.1.icmp_intimeexcds": 0,
 "2.1.icmp_intimestamps": 0,
 "2.1.icmp_outaddrmaskreps": 0,
 "2.1.icmp_outaddrmasks": 0,
 "2.1.icmp_outdestunreachs": 0,
 "2.1.icmp_outechoreps": 0,
 "2.1.icmp_outechos": 0,
 "2.1.icmp_outerrors": 0,
 "2.1.icmp_outmsgs": 0,
 "2.1.icmp_outparamprobs": 0,
 "2.1.icmp_outredirects": 0,
 "2.1.icmp_outsrcquenchs": 0,
 "2.1.icmp_outtimeexcds": 0,
 "2.1.icmp_outtimestampreps": 0,
 "2.1.icmp_outtimestamps": 0,
 "2.1.interrupts": 4438.56380300131,
 "2.1.ip_defaultttl": 64,
 "2.1.ip_forwarding": 2,
 "2.1.ip_forwdatagrams": 0,
 "2.1.ip_fragcreates": 0,
 "2.1.ip_fragfails": 0,
 "2.1.ip_fragoks": 0,
 "2.1.ip_inaddrerrors": 0,
 "2.1.ip_indelivers": 9.165072011280088,
 "2.1.ip_indiscards": 0,
 "2.1.ip_inhdrerrors": 0,
 "2.1.ip_inreceives": 9.215429549803606,
 "2.1.ip_inunknownprotos": 0,
 "2.1.ip_outdiscards": 0,
 "2.1.ip_outnoroutes": 0,
 "2.1.ip_outrequests": 2.1653741565112297,
 "2.1.ip_reasmfails": 0,
 "2.1.ip_reasmoks": 0,
 "2.1.ip_reasmreqds": 0,
 "2.1.ip_reasmtimeout": 0,
 "2.1.load_fifteen": 0.05,
 "2.1.load_fifteen_per_cpu": 0.0125,
 "2.1.load_five": 0.02,
 "2.1.load_five_per_cpu": 0.005,
 "2.1.load_one": 0,
 "2.1.load_one_per_cpu": 0,
 "2.1.machine_type": "arm",
 "2.1.mem_buffers": 52133888,
 "2.1.mem_cached": 383287296,
 "2.1.mem_free": 238026752,
 "2.1.mem_shared": 0,
 "2.1.mem_total": 970506240,
 "2.1.mem_used": 297058304,
 "2.1.mem_utilization": 30.608591437339783,
 "2.1.os_name": "linux",
 "2.1.os_release": "4.4.9-v7+",
 "2.1.page_in": 0,
 "2.1.page_out": 2.2157316950347465,
 "2.1.part_max_used": 31.74,
 "2.1.pkts_in": 11.582233860408904,
 "2.1.pkts_out": 2.266089233558264,
 "2.1.proc_run": 1,
 "2.1.proc_total": 237,
 "2.1.read_time": 0,
 "2.1.reads": 0,
 "2.1.swap_free": 104853504,
 "2.1.swap_in": 0,
 "2.1.swap_out": 0,
 "2.1.swap_total": 104853504,
 "2.1.tcp_activeopens": 0,
 "2.1.tcp_attemptfails": 0,
 "2.1.tcp_currestab": 6,
 "2.1.tcp_estabresets": 0,
 "2.1.tcp_incsumerrs": 0,
 "2.1.tcp_inerrs": 0,
 "2.1.tcp_insegs": 2.568234464699365,
 "2.1.tcp_maxconn": 4294967295,
 "2.1.tcp_outrsts": 0,
 "2.1.tcp_outsegs": 1.913586463893645,
 "2.1.tcp_passiveopens": 0,
 "2.1.tcp_retranssegs": 0,
 "2.1.tcp_rtoalgorithm": 1,
 "2.1.tcp_rtomax": 120000,
 "2.1.tcp_rtomin": 200,
 "2.1.udp_incsumerrors": 0,
 "2.1.udp_indatagrams": 6.596837546580723,
 "2.1.udp_inerrors": 0,
 "2.1.udp_noports": 0,
 "2.1.udp_outdatagrams": 0.2517876926175849,
 "2.1.udp_rcvbuferrors": 0,
 "2.1.udp_sndbuferrors": 0,
 "2.1.uptime": 46603,
 "2.1.uuid": "22c4ce8c-067e-4517-8c00-8d822efc4897",
 "2.1.write_time": 8.333333333333334,
 "2.1.writes": 0.6042904622822036,
 "2.ifadminstatus": "up",
 "2.ifdirection": "full-duplex",
 "2.ifindex": "2",
 "2.ifindiscards": 0,
 "2.ifinerrors": 0,
 "2.ifinoctets": 3241.1101037574294,
 "2.ifinpkts": 11.483831973405863,
 "2.ifinucastpkts": 11.483831973405863,
 "2.ifinutilization": 0.025928880830059432,
 "2.ifname": "eth0",
 "2.ifoperstatus": "up",
 "2.ifoutdiscards": 0,
 "2.ifouterrors": 0,
 "2.ifoutoctets": 406.6686813740304,
 "2.ifoutpkts": 1.8636043114737586,
 "2.ifoutucastpkts": 1.8636043114737586,
 "2.ifoututilization": 0.0032533494509922435,
 "2.ifspeed": 100000000,
 "2.iftype": "ethernetCsmacd",
 "sensors.tempC": 49.388
}
Note the custom temperature metric at the end of the list.

In addition, enabling traffic monitoring in the Host sFlow agent provides detailed flow information along with the metrics to provide visibility into interactions between the devices on the network. In this case the wired Ethernet interface (eth0) is being monitored, but monitoring the wireless interface (wlan0) would be a way to gain visibility into messages exchanged over an ad-hoc wireless mesh network connecting devices. RESTflow describes how to perform flow analytics using sFlow-RT.

In conclusion, sFlow provides a standard way to export metrics and traffic information. Most network equipment vendors already provide sFlow support and the technology has a number of architectural features that are well suited to addressing the challenges of extending visibility to and gathering telemetry from large scale IoT deployments.

Sunday, May 22, 2016

OpenNSL

Open Network Switch Layer (OpenNSL) is a library of network switch APIs that is openly available for programming Broadcom network switch silicon based platforms. These open APIs enable development of networking application software based on Broadcom network switch architecture based platforms.

The recent inclusion of the APIs needed to enable sFlow instrumentation in Broadcom hardware allows open source network operating systems such as OpenSwitch and Open Network Linux to implement the sFlow telemetry standard.

Thursday, January 21, 2016

Podcast with Nick Buraglio and Brent Salisbury

"Have you seen sFlow options in your router configuration or flow collector? Are you looking for alternatives to SNMP or NetFlow? Have you been curious about the instrumentation of your new white box or virtual switch? Yes? Then you will probably enjoy learning more about sFlow!"

Non-Blocking #1: SFlow With Peter Phaal Of InMon And SFlow.Org is a discussion between Brent Salisbury (networkstatic.net), Nick Buraglio (forwardingplane.net), and Peter Phaal (blog.sflow.com).

Web sites and tools mentioned in the podcast:
  1. sFlow.org
  2. Devices that support sFlow
  3. Software to analyze sFlow
  4. sFlow.org mailing list
  5. sFlow structures
  6. blog.sflow.com (incorrectly referenced as blog.sflow.org in the podcast)
  7. Host sFlow
  8. sflowtool

The podcast touches on a number of topics that have been explored in greater detail on this blog. The topics are listed in roughly the order they are mentioned in the podcast:
  1. Widespread support for sFlow among switch vendors
  2. Disaggregated flow cache
  3. ULOG
  4. Push vs Pull
  5. sFlow vs SNMP for interface counters
  6. Broadcom ASIC table utilization metrics, DevOps, and SDN
  7. Broadcom BroadView Instrumentation
  8. Rapidly detecting large flows, sFlow vs. NetFlow/IPFIX
  9. SDN and large flows
  10. Probes
  11. Packet headers
  12. Network virtualization visibility demo
  13. History of sFlow
  14. Standards
  15. Open vSwitch performance monitoring
  16. Wireless
  17. Prescriptive vs descriptive standards (sFlow / IPFIX)
  18. RMON (4 groups)
  19. Observability
  20. Host sFlow distributed agent
  21. Host sFlow data model
  22. Multi-tenant traffic in virtualized network environments
  23. Workload placement
  24. SDN router using merchant silicon top of rack switch
  25. White box Internet router PoC
  26. Active Route Manager
  27. Leaf and spine traffic engineering using segment routing and SDN
  28. CORD: Open-source spine-leaf Fabric (demo from 2015 Open Networking Summit)
  29. sflowtool
  30. sflowtool for packet caputure
  31. sflowtool with Wireshark

Saturday, December 12, 2015

Custom events

Measuring Page Load Speed with Navigation Timing describes the standard instrumentation built into web browsers. This article will use navigation timing as an example to demonstrate how custom sFlow events augment standard sFlow instrumentation embedded in network devices, load balancers, hosts and web servers.

The JQuery script can be embedded in a web page to provide timing information:
$(window).load(function(){
 var samplingRate = 10;
 if(samplingRate !== 1 && Math.random() > (1/samplingRate)) return;

 setTimeout(function(){
   if(window.performance) {
     var t = window.performance.timing;
     var msg = {
       sampling_rate : samplingRate,
       t_url         : {type:"string",value:window.location.href},
       t_useragent   : {type:"string",value:navigator.userAgent},
       t_loadtime    : {type:"int32",value:t.loadEventEnd-t.navigationStart},
       t_connecttime : {type:"int32",value:t.responseEnd-t.requestStart} 
     };
     $.ajax({
       url:"/navtiming.php",
       method:"PUT",
       contentType:"application/json",
       data:JSON.stringify(msg) 
     });
    }
  }, 0);
});
The script supports random sampling. In this case a samplingRate of 10 means that, on average, 1-in-10 page hits will generate a measurement record. Measurement records are sent back to the server where the navtiming.php script acts as a gateway, augmenting the measurements and sending them as custom sFlow events.
<?php
$rawInput = file_get_contents("php://input");
$rec = json_decode($rawInput);
$rec->datasource = "navtime";
$rec->t_ip = array("type" => "ip", "value" => $_SERVER['REMOTE_ADDR']);

$msg=array("rtflow"=>$rec);
$sock = fsockopen("udp://localhost",36343,$errno,$errstr);
if(! $sock) { return; }
fwrite($sock, json_encode($msg));
fclose($sock);
?>
In this case the remote IP address associated with the client browser is added to the measurement before it is formatted as a JSON rtflow message and sent to the Host sFlow agent (hsflowd) running on the web server host. The Host sFlow agent encodes the data as an sFlow structure and sends it to the sFlow collector as part of the telemetry stream.

The following sflowtool output verifies that the metrics are being received at the sFlow Analyzer:
startSample ----------------------
sampleType_tag 4300:1003
sampleType RTFLOW
rtflow_datasource_name navtime
rtflow_sampling_rate 1
rtflow_sample_pool 0
rtflow t_url = (string) "http://10.0.0.84/index.html"
rtflow t_useragent = (string) "Mozilla/5.0 (Macintosh; Intel Mac OS X 10_11_2) AppleWebKit/537.36 (KHTML, like Gecko) Chrome/47.0.2526.80 Safari/537.36"
rtflow t_loadtime = (int32) 115
rtflow t_connecttime = (int32) 27
rtflow t_ip = (ip) 10.1.1.63
endSample   ----------------------
A more interesting way to consume the data is to use sFlow-RT. For example, the following REST API call programs the sFlow-RT analytics pipeline to create a metric that tracks average t_loadtime by URL:
curl -H "Content-Type:application/json" -X PUT --data '{keys:"t_url",value:"avg:t_loadtime",t:15}' http://localhost:8008/flow/urlloadtime/json
The following query can be used to retrieves the resulting metric value:
curl http://localhost:8008/metric/ALL/urlloadtime/json
[{
 "agent": "10.0.0.84",
 "dataSource": "navtime",
 "lastUpdate": 1807,
 "lastUpdateMax": 1807,
 "lastUpdateMin": 1807,
 "metricN": 1,
 "metricName": "urlloadtime",
 "metricValue": 11.8125,
 "topKeys": [{
  "key": "http://10.0.0.84/index.html",
  "lastUpdate": 1807,
  "value": 11.8125
 }]
}]
RESTflow describes the sFlow-RT REST API used to create flow definitions and access flow based metrics and Defining Flows provides reference material.

Installing mod-sflow provides a rich set of transaction and counter metrics from the Apache web server, including information on worker threads, see Thread pools.

Telemetry from Apache, Host sFlow and the custom events are all combined at the sFlow analyzer. For example, the following query pulls together the load average on the server, with Apache thread pool utilization and URL load times:
curl http://localhost:8008/metric/10.0.0.84/load_one,workers_utilization,urlloadtime/json
[
 {
  "agent": "10.0.0.84",
  "dataSource": "2.1",
  "lastUpdate": 23871,
  "lastUpdateMax": 23871,
  "lastUpdateMin": 23871,
  "metricN": 1,
  "metricName": "load_one",
  "metricValue": 0
 },
 {
  "agent": "10.0.0.84",
  "dataSource": "3.80",
  "lastUpdate": 4123,
  "lastUpdateMax": 4123,
  "lastUpdateMin": 4123,
  "metricN": 1,
  "metricName": "workers_utilization",
  "metricValue": 0.390625
 },
 {
  "agent": "10.0.0.84",
  "dataSource": "navtime",
  "lastUpdate": 8821,
  "lastUpdateMax": 8821,
  "lastUpdateMin": 8821,
  "metricN": 1,
  "metricName": "urlloadtime",
  "metricValue": 91.81072992715491,
  "topKeys": [{
   "key": "http://10.0.0.84/index.html",
   "lastUpdate": 8821,
   "value": 91.81072992715491
  }]
 }
]
The article, Cluster performance metrics, describes the metric API in more detail. Additional sFlow-RT APIs can be used to send data to a variety of DevOps tools, including: Ganglia, Graphite, InfluxDB and Grafana, Logstash, Splunk, cloud analytics services.

Finally, standard sFlow instrumentation is also widely implemented by physical and virtual network devices. Combining data from all these sources provides a comprehensive real-time view of applications and the compute, storage and networking resources that the applications depend on.

Monday, December 7, 2015

Broadcom BroadView Instrumentation

The diagram above, from the BroadView™ 2.0 Instrumentation Ecosystem presentation, illustrates how instrumentation built into the network Data Plane (the Broadcom Trident/Tomahawk ASICs used in most data center switches) provides visibility to Software Defined Networking (SDN) controllers so that they can optimize network performance.
The sFlow measurement standard provides open, scaleable, multi-vendor, streaming telemetry that supports SDN applications. Broadcom has been augmenting the rich set of counter and flow measurements in the base sFlow standard with additional metrics. For example, Broadcom ASIC table utilization metrics, DevOps, and SDN describes metrics that were added to track ASIC table resource consumption.

The highlighted Buffer congestion state / statistics capability in the slide refers to the BroadView Buffer Statistics Tracking (BST) instrumentation. The Memory Management Unit (MMU) is on-chip logic that manages how the on-chip packet buffers are organized.  BST is a feature that enables tracking the usage of these buffers. It includes snapshot views of peak utilization of the on-chip buffer memory across queues, ports, priority group, service pools and the entire chip.
The above chart from the Broadcom technical brief, Building an Open Source Data Center Monitoring Tool Using Broadcom BroadView™ Instrumentation Software, shows buffer utilization trended over an hour.

While the trend chart is useful, the value of BST instrumentation is fully realized when the data is integrated into the sFlow telemetry stream, allowing buffer utilizations to be correlated with traffic flows consuming the buffers. Broadcom's recently published sFlow extension, sFlow Broadcom Peak Buffer Utilization Structures, standardizes the export of the buffer metrics, ensures multi-vendor interoperability, and providing the comprehensive, actionable, telemetry from the network required by SDN applications.

Ask switch vendors about their plans to support the extension in their sFlow implementations. The enhanced visibility into buffer utilization addresses a number of important use cases:
  • Fabric-wide visibility into peak buffer utilization
  • Derive worst end to end case latency
  • Pro-actively track microbursts and identify hot spots before packets are lost
  • Correlate with traffic flows and link utilizations
  • Improve performance through QoS marking, load spreading, and workload placement