Monday, April 10, 2023

VyOS DDoS mitigation

Real-time flow analytics on VyOS describes how to install real-time analytics based on sFlow and the sFlow-RT analytics engine. This article extends the example to show how to automatically mitigate DDoS attacks using flow analytics combined with BGP Remotely Triggered Black Hole (RTBH) / Flowspec.
vyos@vyos:~$ add container image sflow/ddos-protect
First, download the sflow/ddos-protect image.
vyos@vyos:~$ mkdir -m 777 /config/sflow-rt
Create a directory to store persistent container state.
set container network sflowrt prefix 192.168.1.0/24
Define an internal network to connect to container. Currently VyOS BGP does not allow direct connections to local addresses (e.g. 127.0.0.1), so we need to put controller on its own network so the router can connect and receive DDoS mitigation BGP RTBH / Flowspec controls.
set container name sflow-rt image sflow/ddos-protect
set container name sflow-rt host-name sflow-rt
set container name sflow-rt arguments '-Dddos_protect.router=192.168.1.1 -Dddos_protect.enable.flowspec=yes'
set container name sflow-rt environment RTMEM value 200M
set container name sflow-rt memory 0
set container name sflow-rt volume store source /config/sflow-rt
set container name sflow-rt volume store destination /sflow-rt/store
set container name sflow-rt network sflowrt address 192.168.1.2

Configure a container to run the image. The -Dddos_protect.router argument sets the BGP neighbor address, 192.168.1.1.

vyos@vyos:~$ ifconfig podman-sflowrt
podman-sflowrt: flags=4163<UP,BROADCAST,RUNNING,MULTICAST>  mtu 1500
        inet 192.168.1.1  netmask 255.255.255.0  broadcast 192.168.1.255
        ether be:9e:69:f4:d0:4e  txqueuelen 1000  (Ethernet)
        RX packets 28  bytes 2662 (2.5 KiB)
        RX errors 0  dropped 0  overruns 0  frame 0
        TX packets 27  bytes 8032 (7.8 KiB)
        TX errors 0  dropped 0 overruns 0  carrier 0  collisions 0
Connections to containers on sflowrt container network appear to originate from 192.168.1.1, the address assigned to VyOS interface podman-sflowrt.
set system sflow interface eth0
set system sflow interface eth1
set system sflow interface eth2
set system sflow polling 30
set system sflow sampling-rate 1000
set system sflow drop-monitor-limit 50
set system sflow server 192.168.1.2
Configure sFlow and send to sflow-rt container address 192.168.1.2.
set protocols bgp system-as 64500
set protocols bgp neighbor 192.168.1.2 port 1179
set protocols bgp neighbor 192.168.1.2 remote-as 65000
set protocols bgp neighbor 192.168.1.2 address-family ipv4-unicast
set protocols bgp neighbor 192.168.1.2 address-family ipv4-flowspec
Configure sflow-rt as BGP neighbor. Documentation ASN 64500 should be replaced by your ASN. The private ASN 65000 is a DDoS Protect default and can be changed with the -Dddos_protect.as argument.
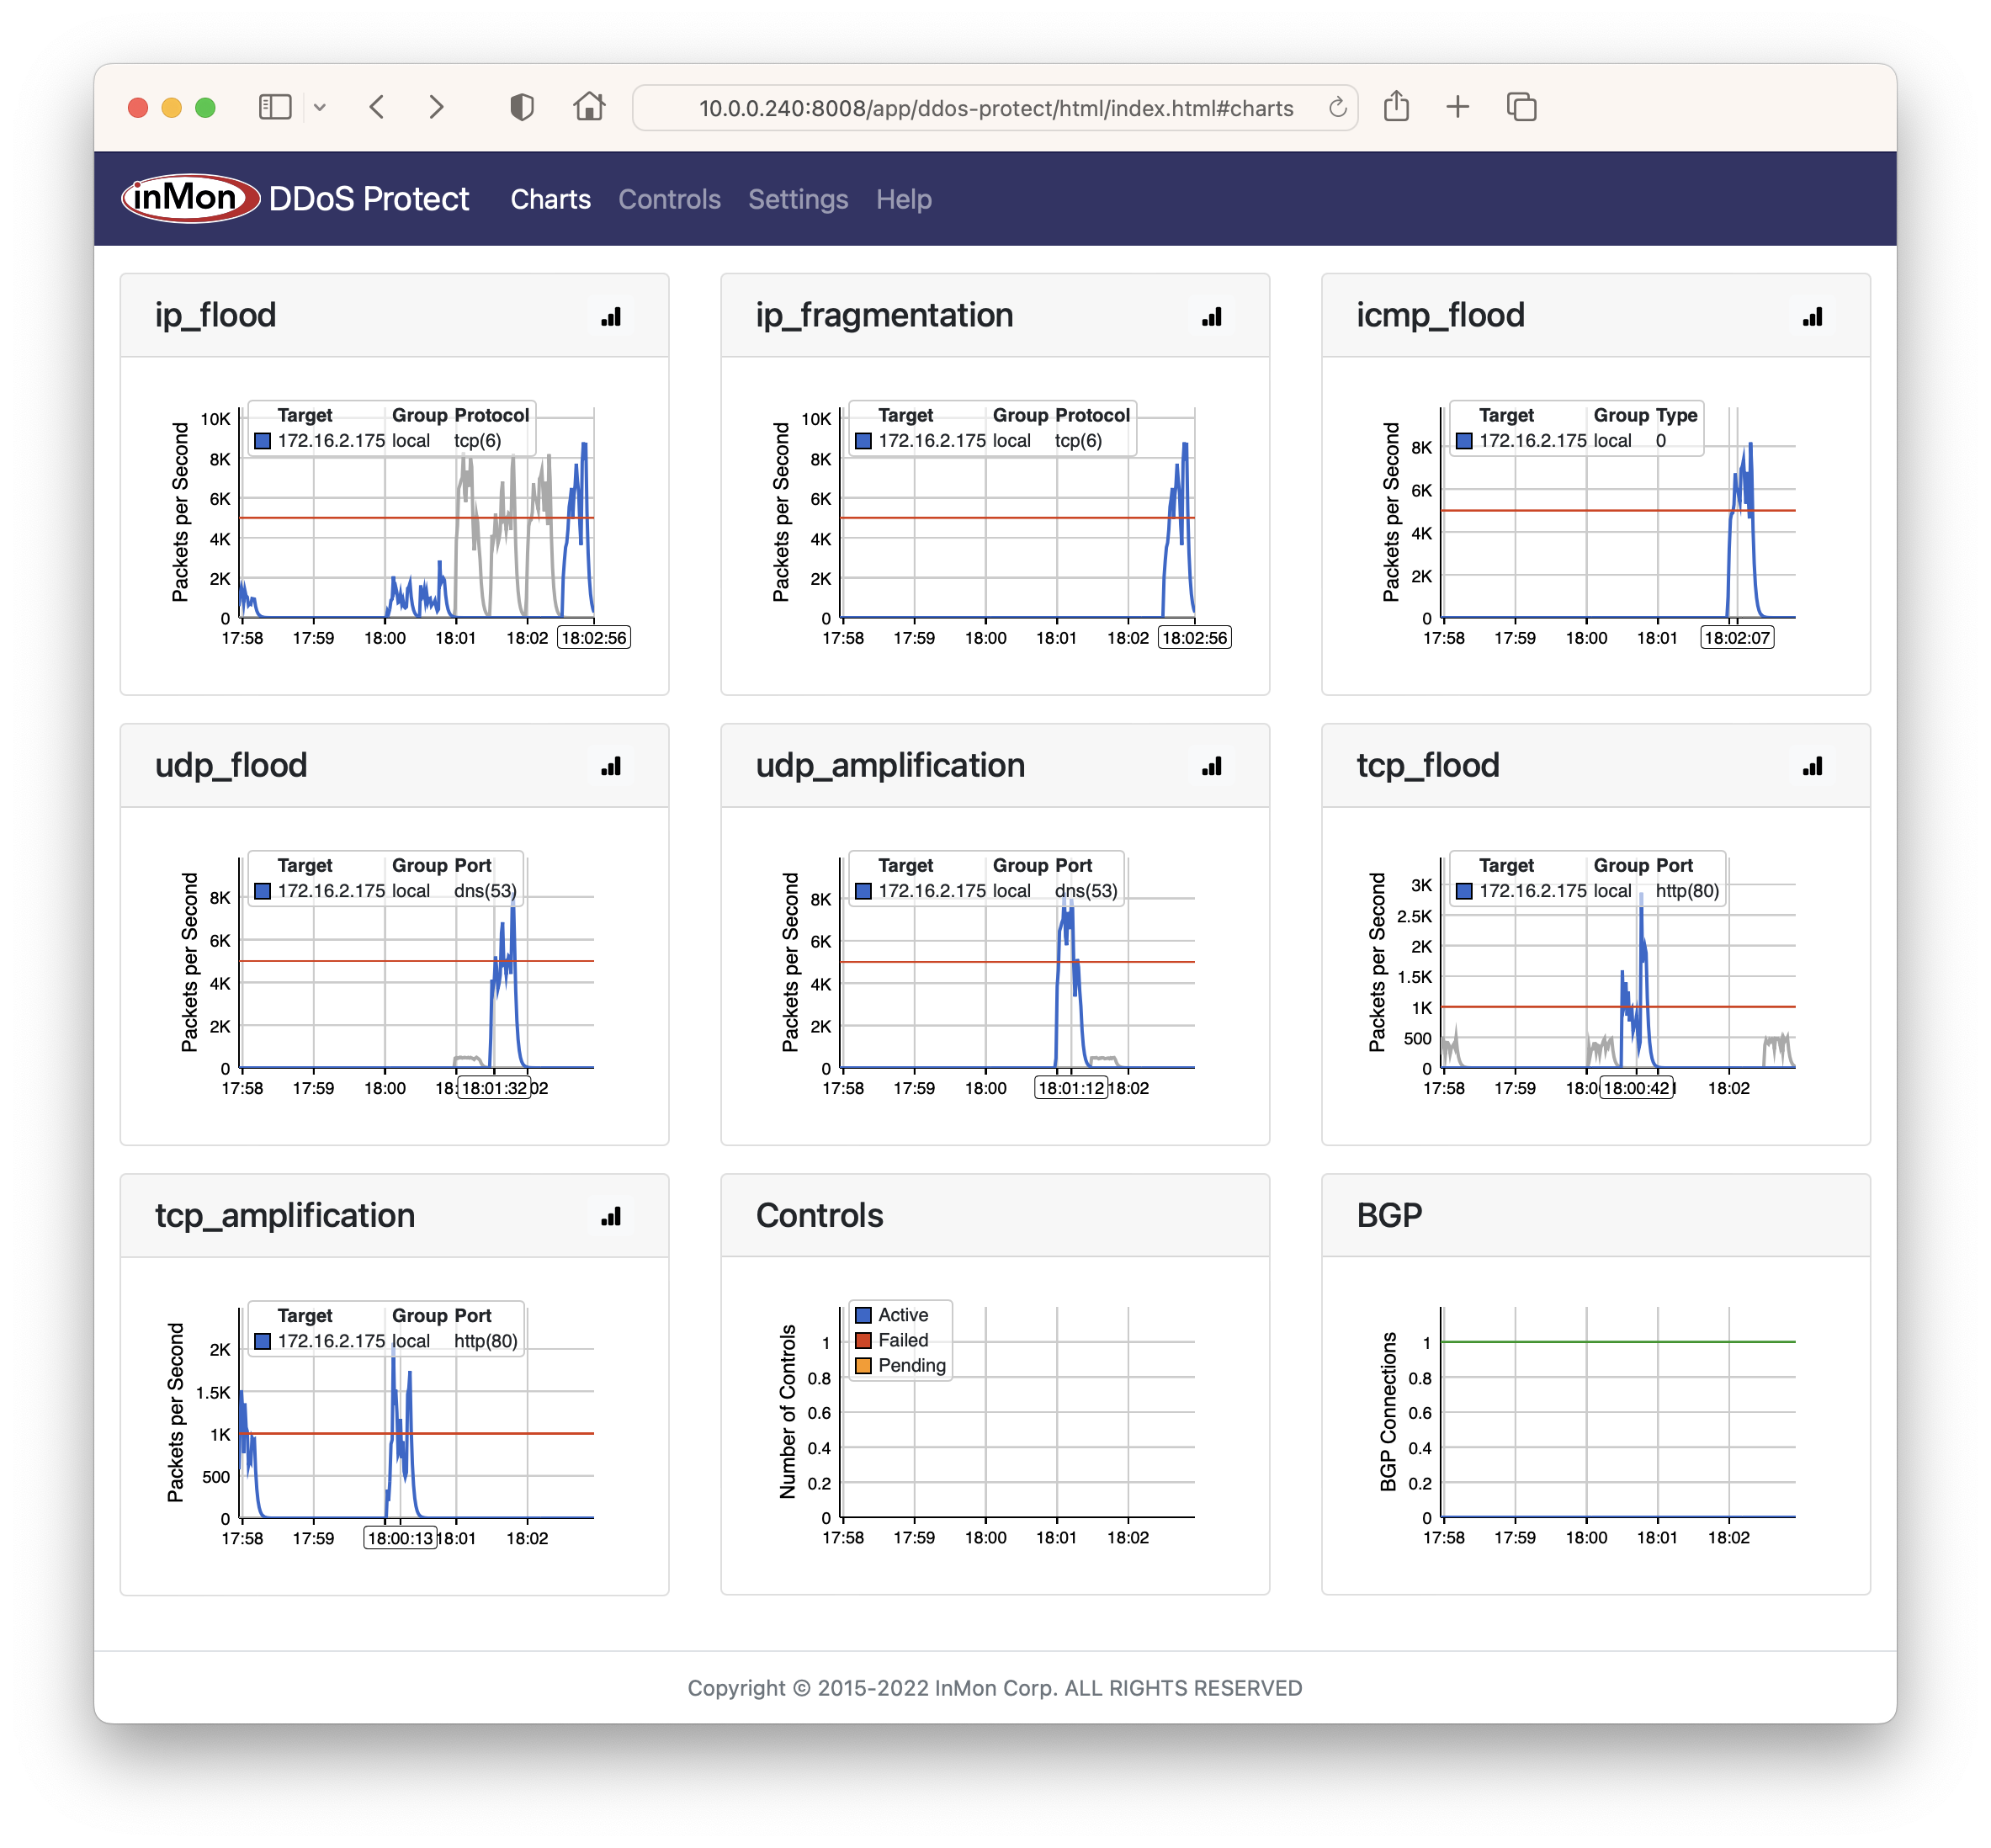
ssh -L 8008:192.168.1.2:8008 vyos@router.example
Use ssh tunnel to connect to the container network and access web interface at http://localhost:8008.
Real-time DDoS mitigation using BGP RTBH and FlowSpec describes how to configure the DDoS protect application. The screen capture above shows the Charts page after a couple of simulated DDoS attacks on an address, 198.51.100.129, protected by the VyOS router. The charts show two ip_flood and a single udp_amplification attack - see DDoS attacks and BGP Flowspec responses for information on simulating different types of DDoS attack to test mitigation responses.
The Controls page shows three active controls. The table shows the targeted address, administrative address group, attack type, protocol, detection time, mitigation action and status of each active DDoS attack.
vyos@vyos:~$ show bgp ipv4
BGP table version is 0, local router ID is 192.168.1.1, vrf id 0
Default local pref 100, local AS 64500
Status codes:  s suppressed, d damped, h history, * valid, > best, = multipath,
               i internal, r RIB-failure, S Stale, R Removed
Nexthop codes: @NNN nexthop's vrf id, < announce-nh-self
Origin codes:  i - IGP, e - EGP, ? - incomplete
RPKI validation codes: V valid, I invalid, N Not found

    Network          Next Hop            Metric LocPrf Weight Path
    198.51.100.129/32
                    192.0.2.1                              0 65000 i

Displayed  1 routes and 1 total paths
The show command verifies that a Remotely Triggered Black Hole (RTBH) rule has been received for the drop mitigation actions. Advertising a black hole route risks collateral damage since it drops all traffic to the targetted host in order to protect network bandwidth and services provided by other hosts. 
vyos@vyos:~$ show bgp ipv4 flowspec detail 
BGP flowspec entry: (flags 0x418)
        Destination Address 198.51.100.129/32
        IP Protocol = 17 
        Source Port = 53 
        FS:rate 0.000000
        received for 00:00:12
        not installed in PBR
The show command verifies that a Flowspec rule has been received for the filter mitigation action. Using Flowspec to filter traffic is more targetted than using black hole routes. In this case only UDP traffic (IP Protocol 17) with Source Port 53 (DNS) is dropped, all other services provided by the targetted host are still accessible.
vyos@vyos:~$ show log container sflow-rt 
2023-04-08T00:24:14Z INFO: Starting sFlow-RT 3.0-1681
2023-04-08T00:24:16Z INFO: Version check, running latest
2023-04-08T00:24:17Z INFO: Listening, BGP port 1179
2023-04-08T00:24:18Z INFO: Listening, sFlow port 6343
2023-04-08T00:24:19Z INFO: Listening, HTTP port 8008
2023-04-08T00:24:19Z INFO: DNS server 1.1.1.1
2023-04-08T00:24:19Z INFO: app/ddos-protect/scripts/ddos.js started
2023-04-08T00:24:19Z INFO: app/prometheus/scripts/export.js started
2023-04-08T00:24:19Z INFO: app/browse-drops/scripts/top.js started
2023-04-08T00:24:19Z INFO: app/browse-flows/scripts/top.js started
2023-04-08T00:26:11Z INFO: BGP open 192.168.1.1 51252
2023-04-08T14:37:36Z INFO: DDoS drop ip_flood 198.51.100.129 local 47
2023-04-08T14:38:19Z INFO: DDoS filter udp_amplification 198.51.100.129 local 53
2023-04-08T14:38:19Z INFO: DDoS drop ip_flood 198.51.100.129 local 17
Attacks are recorded in the container log. Monitoring DDoS mitigation describes how to use Prometheus / Elasticsearch / Grafana to monitor DDoS activity and build dashboards.

This is only a partial configuration. Peering sessions with upstream routers need to be configured to propagate controls so that DDoS attack traffic can be blocked before it saturates the upstream link. The limited scrubbing capacity of the VyOS software router isn't a factor since traffic will be dropped in hardware upstream. The flexibility of the VyOS router is an advantage in providing visibility and analytics to quickly trigger mitigation actions.

Tuesday, April 4, 2023

Real-time flow analytics on VyOS

VyOS with Host sFlow agent describes support for streaming sFlow telemetry added to the open source VyOS router operating system. This article describes how to install analytics software on a VyOS router by configuring a container.
vyos@vyos:~$ add container image sflow/ddos-protect
First, download the sflow/ddos-protect image.
vyos@vyos:~$ mkdir -m 777 /config/sflow-rt
Create a directory to store persistent container state.
set container name sflow-rt image sflow/ddos-protect
set container name sflow-rt allow-host-networks
set container name sflow-rt arguments '-Dhttp.hostname=10.0.0.240'
set container name sflow-rt environment RTMEM value 200M
set container name sflow-rt memory 0
set container name sflow-rt volume store source /config/sflow-rt
set container name sflow-rt volume store destination /sflow-rt/store
Configure a container to run the image. The RMEM environment variable setting limits the amount of memory that the container will use to 200M bytes. The -Dhttp.hostname argument sets the internal web server to listen on management address, 10.0.0.240, assigned to eth0 on this router. The container has is no built-in authentication, so access needs to be limited using an ACL or through a reverse proxy - see Download and install.
set system sflow interface eth0
set system sflow interface eth1
set system sflow interface eth2
set system sflow polling 30
set system sflow sampling-rate 1000
set system sflow drop-monitor-limit 50
set system sflow server 127.0.0.1
Next, configure sFlow agent to send to localhost (127.0.0.1).
Finally connect to the web interface on the router at port 8008. The status page verifies that the sFlow-RT analytics engine is receiving sFlow from 1 sFlow Agent (the VyOS router). See Getting started for more information.
The included Flow Browser application provides an up to the second view traffic flows. Defining Flows describes the fields that can be used to break out traffic.
VyOS dropped packet notifications describes how to configure and monitor sFlow dropped packet notifications. The included Discard Browser provides an up to the second view of dropped packets.
The included Metric Browser application lets you explore the metrics that are being streamed. The chart updates in real-time as data arrives and in this case shows CPU utilization on the VyOS router. The standard set of metrics exported by the Host sFlow agent include interface counters as well as host cpu, memory, network and disk performance metrics. Metrics lists the set of available metrics.
Flow metrics with Prometheus and Grafana describes how integrate flow analytics into operational dashboards. The included Prometheus application exposes flow analytics in the standard Prometheus scrape format so that they can be logged in time series databases.
DDoS protection quickstart guide describes how to use real-time sFlow analytics with BGP Flowspec / RTBH to automatically mitigate DDoS attacks. The included DDoS Protect application detects common volumetric attacks and can apply automated responses. The screen capture shows traffic associated with a series of simulated DDoS attacks against hosts behind the VyOS router, see DDoS attacks and BGP Flowspec responses.
The embedded sFlow-RT analytics engine exposes a REST API that can be used to program flow analytics, set thresholds, monitor events, and gather statistics. In addition, the applications shown in this article were all written using sFlow-RT's embedded scripting API. See Writing Applications for more information.

Monday, April 3, 2023

Dropped packet reason codes in VyOS

The article VyOS with Host sFlow agent describes how to use industry standard sFlow telemetry to monitor network traffic flows and statistics in the latest VyOS rolling releases. VyOS dropped packet notifications describes how sFlow also provides visibility into network packet drops and Dropped packet reason codes in Linux 6+ kernels describes how newer kernels are able to provide specific reasons for dropping packets. 
vyos@vyos:~$ uname -r
6.1.22-amd64-vyos

The latest VyOS rolling release runs on a Linux 6.1 kernel and the latest release of VyOS now provides enhanced visibility into dropped packets using kernel reason codes.

vyos@vyos:~$ show version
Version:          VyOS 1.4-rolling-202303310716
Release train:    current

Built by:         autobuild@vyos.net
Built on:         Fri 31 Mar 2023 07:16 UTC
Build UUID:       1a7448d9-d53c-48a0-8644-ed1970c1abb8
Build commit ID:  75c9311fba375e

Architecture:     x86_64
Boot via:         installed image
System type:       guest

Hardware vendor:  innotek GmbH
Hardware model:   VirtualBox
Hardware S/N:     0
Hardware UUID:    da75808d-ff60-1d4c-babd-84a7fa341053

Copyright:        VyOS maintainers and contributors
Verify that the version of of VyOS is VyOS 1.4-rolling-202303310716 or later.

In the previous article, VyOS dropped packet notifications,  two tests were performed, the first a failed attempt to connect to the VyOS router using telnet (telnet has been disabled in the router config), and the second a traceroute test between two hosts connected to the router. The sFlow drop reason codes reported for these two tests were unknown_l4 and unknown_l3 respectively. The Linux kernel functional names weren't much more specific, tcp_v4_rcv and ip_forward respectively. However, in this case, the Linux 6.1 kernel instrumentation allows more specific sFlow drop reasons to be reported, as shown in the chart at the top of this article.

  • port_unreachable This sFlow drop reason code is defined by reference to RFC 1812 section 5.2.7.1 and is defined as "Port Unreachable - generated if the designated transport protocol (e.g., UDP) is unable to demultiplex the datagram in the transport layer of the final destination but has no protocol mechanism to inform the sender"
  • ip_1_parsing This sFlow drop reason code is defined by reference to Devlink Trap and is defined as "Traps packets dropped due to an error in the first IP header parsing. This packet trap could include packets which do not pass an IP checksum check, a header length check (a minimum of 20 bytes), which might suffer from packet truncation thus the total length field exceeds the received packet length etc."
The detailed reasons make it easier to identify the root causes of packet drops, particularly when combined with information from the dropped packet's header that is also included in the sFlow Dropped Packet Notification messages.