Showing posts with label control. Show all posts

Monday, March 7, 2022

Who monitors the monitoring systems?

Adrian Cockroft poses an interesting question in, Who monitors the monitoring systems? He states, The first thing that would be useful is to have a monitoring system that has failure modes which are uncorrelated with the infrastructure it is monitoring. ... I don’t know of a specialized monitor-of-monitors product, which is one reason I wrote this blog post.

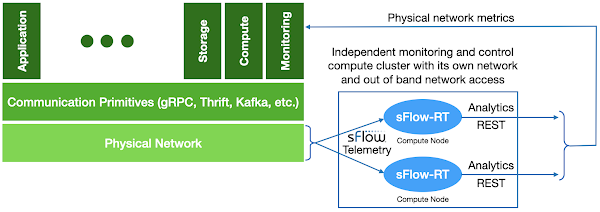
This article offers a response, describing how to introduce an uncorrelated monitor-of-monitors into the data center to provide real-time visibility that survives when the primary monitoring systems fail.

Summary of the AWS Service Event in the Northern Virginia (US-EAST-1) Region, This congestion immediately impacted the availability of real-time monitoring data for our internal operations teams, which impaired their ability to find the source of congestion and resolve it. December 10th, 2021

Standardizing on a small set of communication primitives (gRPC, Thrift, Kafka, etc.) simplifies the creation of large scale distributed services. The communication primitives abstract the physical network to provide reliable communication to support distributed services running on compute nodes. Monitoring is typically regarded as a distributed service that is part of the compute infrastructure, relying on agents on compute nodes to transmit measurements to scale out analysis, storage, automation, and presentation services.

System wide failures occur when the network abstraction fails and the limitations of the physical network infrastructure intrude into the overlaid monitoring, compute, storage, and application services. Physical network service failure is the Achilles heel of distributed compute infrastructure since the physical network is the glue that ties the infrastructure together.

However, the physical network is also a solution to the monitoring problem, providing an independent uncorrelated point of observation that has visibility into all the physical network resources and the services that run over them.
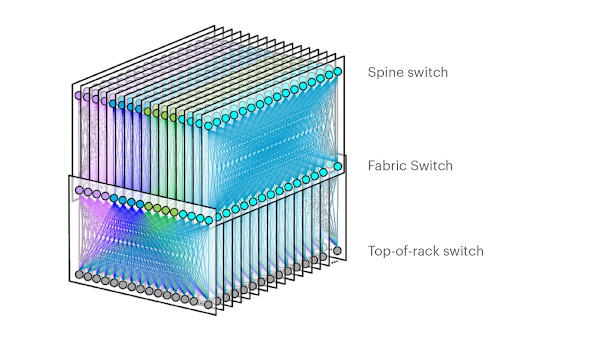
Reinventing Facebook’s data center network describes the architecture of a data center network. The network is a large distributed system made up of thousands of hardware switches and the tens of thousands of optical links that connect them. The network can route trillions of packets per second and has a capacity measured in Petabits/second.

The industry standard sFlow measurement system, implemented by all major data center network equipment vendors, is specifically designed to address the challenge of monitoring large scale switched networks. The sFlow specification embeds standard instrumentation into the hardware of each switch, making monitoring an integral part of the function of the switch, and ensuring that monitoring capacity scales out as network size increases.
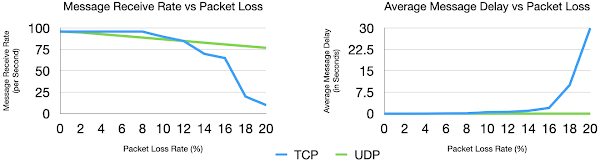
UDP vs TCP for real-time streaming telemetry describes how sFlow uses UDP to transport measurements from the network devices to the analytics software in order to maintain real-time visibility during network congestion events. The graphs from the article demonstrate that the different transport characteristics of UDP and TCP decouple the physical network monitoring system from the primary monitoring systems which typically depend on TCP services.

The diagram at the top of this article shows the elements of an sFlow monitoring system designed to provide independent visibility into large scale data center network infrastructure.

Each network device can be configured to send sFlow telemetry to at least two destinations. In the diagram two independent instances of the sFlow-RT real-time analytics engine are deployed on two separate compute nodes, each receiving its own stream of telemetry from all devices in the network. Since both sFlow-RT instances receive the same telemetry stream, they independently maintain copies of the network state that can be separately queried, ensuring availability in the event of a node failure.

Note: Tollerance to packet loss allows sFlow to be sent inband to reduce load on out-of-band management networks without significant loss of visibility. 

Scalability is ensured by sFlow's scale out hardware-based instrumentation. Leveraging the collective capability of the distributed instrumentation allows each sFlow-RT instance to monitor the current state of the entire data center network.

Tuning Performance describes how to optimize sFlow-RT performance for large scale monitoring.

The compute nodes hosting sFlow-RT instances should be physically separate from production compute service and have an independent network with out of band access so that measurements are available in cases were network performance issues have disrupted the production compute service.

This design is intentionally minimalist in order to reliably deliver real-time visibility during periods of extreme network congestion when all other systems fail.

In Failure Modes and Continuous Resilience, Adrian Cockroft states, The first technique is the most generally useful. Concentrate on rapid detection and response. In the end, when you’ve done everything you can do to manage failures you can think of, this is all you have left when that weird complex problem that no-one has ever seen before shows up!

With the state of the network stored in memory, each sFlow-RT instance provides an up to the second view of network performance with query response times measured in milliseconds. Queries are optimized to quickly diagnose network problems:

  • Detect network congestion
  • Identify traffic driving congestion
  • Locate control points to mitigate congestion
Real-time traffic analytics can drive automated remediation for common classes of problem to rapidly restore network service. Automated responses include:
  • Filtering out DDoS traffic
  • Shed non-essential services
  • Re-routing traffic
  • Shaping traffic
Of course, reliable control actions require an out-of-band management network so that controls can be deployed even if the production network is failing. Once physical network congestion problems have been addressed, restored monitoring services will provide visibility into production services and allow normal operations to resume. Real-time physical network visibility allows automated control actions to resolve physical network congestion problems within seconds so that there is negligible impact on the production systems.

Physical network visibility has utility beyond addressing extreme congestion events, feeding physical network flow analytics into production monitoring systems augments visibility and provides useful information for intrusion detection, capacity planning, workload placement, autoscaling, and service optimization. In addition, comparing the independently generated flow metrics profiling production services with the metrics generated by the production monitoring systems provides an early warning of  monitoring system reliability. Finally, the low latency of network flow metrics are a leading indicator of performance that can be used to improve the agility of production monitoring and control.

Getting started with sFlow is easy. Ideally, enable sFlow monitoring on the switches in a pod and install an instance of sFlow-RT to see traffic in your own environment, alternatively, Real-time telemetry from a 5 stage Clos fabric describes a lightweight emulation of realistic data center switch topologies using Docker and Containerlab that allows you to experiment with real-time sFlow telemetry and analytics before deploying into production.

Monday, February 14, 2022

UDP vs TCP for real-time streaming telemetry

This article compares UDP and TCP and their suitability for transporting real-time network telemetry. The results obtained demonstrate that poor throughput and high message latency in the face of packet loss makes TCP unsuitable for providing visibility during congestion events. We demonstrate that the use of UDP transport by the sFlow telemetry standard overcomes the limitations of TCP to deliver robust real-time visibility during extreme traffic events when visibility is most needed.
Summary of the AWS Service Event in the Northern Virginia (US-EAST-1) Region, "This congestion immediately impacted the availability of real-time monitoring data for our internal operations teams, which impaired their ability to find the source of congestion and resolve it." December 10th, 2021

The data in these charts was created using Mininet to simulate packet loss in a simple network. If you are interested in replicating these results, Multipass describes how to run Mininet on your laptop.

sudo mn --link tc,loss=5

For example, the above command simulates a simple network consisting of two hosts connected by a switch. A packet loss rate of 5% is configured for each link.

Simple Python scripts running on the simulated hosts were used to simulate transfer of network telemetry.

#!/usr/bin/env python3

import socket
import time
import sys
import struct

HOST = '10.0.0.1'
PORT = 65432

buf = bytearray(1000)
with socket.socket(socket.AF_INET, socket.SOCK_STREAM) as s:
  s.connect((HOST, PORT))
  while True:
    now = time.time()
    buf[0:8] = struct.pack('>d',now)
    s.sendall(buf)
    time.sleep(0.01)

The above sender.py script builds a 1000 byte timestamped message, sends the message, and sleeps for 0.01 seconds, and repeats the steps in a continuous loop. This level of message traffic is typical of what you might see from an sFlow agent embedded in a datacenter switch on a moderately busy network.

#!/usr/bin/env python3

import socket
import time
import struct

HOST = '10.0.0.1'
PORT = 65432 

def recv_msg(sock,n):
  data = bytearray()
  while len(data) < n:
    packet = sock.recv(n - len(data))
    if not packet:
      return None
    data.extend(packet)
  return data

with socket.socket(socket.AF_INET, socket.SOCK_STREAM) as s:
  s.bind((HOST, PORT))
  s.listen()
  conn, addr = s.accept()
  with conn:
    while True:
      data = recv_msg(conn,1000)
      if not data:
        break
      time_sent = struct.unpack('>d',data[0:8])[0]
      time_now = time.time()
      print("%f %f" % (time_now,time_now - time_sent), flush=True)

The above receiver.py script accepts a connection from the sender, reads messages, and computes latency using the encoded sender timestamp.

The average delay is a constant 160 µS for UDP. TCP message delay exceeds 1 second average at 14% packet loss and averages 30 seconds at 20% packet loss.


The maximum measurement delay chart tells a dire story. While UDP never sees a message delay greater than 8 mS, maximum TCP message delay reaches 14 minutes at 20% packet loss!

Both TCP and UDP achieve 96 messages per second throughput at 0% packet loss. UDP throughput declines linearly with packet loss as one would expect, dropping to 77 messages per second at 20% packet loss. The throughput of TCP stays at 96 message per second until the packet loss rate reaches 10%, where it drops to 90 messages per second. At a packet loss of 12% the throughput of TCP / UDP is equal at 85 messages per second. TCP throughput drops off rapidly and falls to 10 messages per second at 20% packet loss.

The results demonstrate that TCP based telemetry fails to provide adequate visibility in the face of packet loss, with a steep drop in throughput and a dramatic increase in delay that makes the measurements useless for real-time troubleshooting and automated control. UDP based telemetry on the other hand provides consistently low message delay and maintains high throughput at the cost of moderate message loss.

The sFlow standard is designed for use with UDP, specifying measurements that degrade gracefully in the presence of expected packet loss:

  1. Monotonic Counters For example, the total number of packets and bytes sent and received on an interface are sent, leaving it up to the sFlow analyzer to compute packet rates and interface utilizations. If a message is lost there is no need for it to be retransmitted since the next message will contain the current value of the counter.
  2. Packet samples sFlow's packet sampling mechanism treats record loss as a decrease in the sampling probability. The sFlow records contain information that allows the traffic analyzer to measure the effective sampling rate, compensate for the packet loss, and generate corrected values. Each sFlow record represents a single packet event and large flows of traffic will generate a number of sFlow records. Thus, the loss of an sFlow record does not represent a significant loss of data and doesn't affect the overall accuracy of traffic measurements.

In addition, recent extensions to the sFlow protocol enhance visibility into sources of delay and packet loss in the network, see: Transit delay and queueing and Real-time trending of dropped packets. As we have demonstrated, services running in the datacenter that rely on TCP will be severely impacted by packet loss and so the ability to monitor and control packet loss is essential for maintaining service levels.

The following articles discuss how sFlow relates to, and complements, emerging telemetry standards:

Deploying an sFlow monitoring solution is straightforward since sFlow is widely implemented in datacenter equipment from vendors including: A10, Arista, Aruba, Cisco, Edge-Core, Extreme, Huawei, Juniper, NEC, Netgear, Nokia, NVIDIA, Quanta, and ZTE. In addition, the open source Host sFlow agent makes it easy to extend visibility beyond the physical network into the compute infrastructure.

The diagram shows the high level architecture for real-time datacenter-wide sFlow analytics. Telemetry continuously streams from all network, host and application instances to a central analyzer which constructs a real-time view of performance, identifying hot spots, and driving automated remediation. In this case the sFlow-RT analytics engine continuously monitors tens of thousands of industry standard sFlow telemetry sources and responds within a seconds to performance challenges.

Finally, a couple of popular use cases give an idea of the solutions that can be built on sFlow real-time telemetry.

DDoS protection quickstart guide describes how to deploy sFlow along with BGP RTBH/Flowspec to automatically detect and mitigate DDoS flood attacks. The use of sFlow provides sub-second visibility into network traffic during the periods of high packet loss experienced during a DDoS attack. The result is a system that can reliably detect and respond to attacks in real-time.

Flow metrics with Prometheus and Grafana describes how to import user defined flow metrics into the Prometheus time series data base and build real-time dashboards using Grafana. Here gain, reliable, low latency measurements during periods of packet loss ensure that operators have the information needed to find the root cause and quickly respond.

Friday, November 13, 2020

sFlow Monitoring for AI


A Proposal towards sFlow Monitoring Dashboards for AI-controlled NRENs is a recent talk by Mariam Kiran (Esnet) presented at the recent GÉANT Telemetry and Big Data Workshop.
In the talk, Miram describes the set open source tools (Netdata, Prometheus, Zabbix, Ntopng, and PerfSONAR) that they attempted to synthesize a complete picture of the network.
A number of tools were combined since each tool provides a different subset of the measurements needed to drive the AI controller. 
Integrating the data from the different sources was a challenge, but they were able to pull the data together into a single Grafana dashboard. Unfortunately, there was a lot of noise in legacy measurement schemes, making the data set unsuitable for training the AI controller.
The team decided to go toward sFlow, replacing the legacy monitoring tools with sFlow enabled devices, in order to generate the very clean data needed for machine learning.

For background, the talk, Real-time network telemetry for automation, describes why sFlow is uniquely suited to automation, providing the comprehensive, real-time, system-wide, visibility needed to make networked systems observable.

Thursday, November 12, 2020

Real-time network telemetry for automation


The video discusses telemetry and requirements for network automation, providing an overview of sFlow measurement architecture and a discussion of recently added packet drop monitoring functionality, and ending with a live demonstration of GPU compute cluster analytics. The slides from the video are available here.

The video is part of recent talk Using Advanced Telemetry to Correlate GPU and Network Performance Issues [A21870] presented at the NVIDIA GTC conference. 

Tuesday, October 6, 2020

Using Advanced Telemetry to Correlate GPU and Network Performance Issues


The image above was captured from the recent talk Using Advanced Telemetry to Correlate GPU and Network Performance Issues [A21870] presented at the NVIDIA GTC conference. The talk includes a demonstration of monitoring a high performance GPU compute cluster in real-time. The real-time dashboard provides an up to the second view of key performance metrics for the cluster.

This diagram shows the elements of the GPU compute cluster that was demonstrated. Cumulus Linux running on the switches reduces operational complexity by allowing you to run the same Linux operating system on the network devices as is run on the compute servers. sFlow telemetry is generated by the open source Host sFlow agent that runs on the servers and the switches, using standard Linux APIs to enable instrumentation and gather measurements. On switches, the measurements are offloaded to the ASIC to provide line rate monitoring.

Telemetry from all the switches and servers in the cluster is streamed to an sFlow-RT analyzer, which builds a real-time view of performance that can be used to drive operational dashboards and automation.

The Real-time GPU and network telemetry dashboard combines measurements from all the devices to provide view of cluster performance. Each of the three charts demonstrated a different type of measurement in the sFlow telemetry stream:
  1. GPU Utilization is based on sFlow's counter push mechanism, exporting NVIDIA Management Library (NVML) counters. This chart trends buffer, memory, and execution utilization of the GPUs in the cluster.
  2. Network Traffic is based on sFlow's random packet sampling mechanism, supported by the Linux kernel on servers, and offloaded to the Mellanox ASIC on the switches. This chart trends the top network flows crossing the network.
  3. Network Drops is based on sFlow's recently added dropped packet notification mechanism, see Using sFlow to monitor dropped packets. This chart trends dropped packet source and destination addresses and the reason the packet was dropped.
The cluster is running a video transcoding workload in which video is streamed across the network to a GPU where it is transcoded, and the result returned. A normal transcoding task is shown on left, where the charts show an increase in GPU and network activity and zero dropped packets. A failed transcoding task is shown in the middle. Here the GPU activity is low, there is no network activity, and there is a sequence of packets dropped by an access control list (ACL). Removing the ACL fixes the problem, which is confirmed by the new data shown on the right of the trend charts.

The sFlow data model integrates the three telemetry streams: counters, packet samples, and drop notifications. Each type of data is useful on its own, but together they provide the system wide observability needed to drive automation.

Monday, June 8, 2020

Large flow marking using BGP Flowspec

Elephant Detection in Virtual Switches & Mitigation in Hardware discusses a VMware and Cumulus demonstration, Elephants and Mice, in which the virtual switch on a host detects and marks large "Elephant" flows and the hardware switch enforces priority queueing to prevent Elephant flows from adversely affecting latency of small "Mice" flows.

SDN and WAN optimization describes a presentation by Amin Vahdat describing Google's SDN based wide area network traffic engineering solution in which traffic prioritization allows Google to reduce costs by fully utilizing WAN bandwidth.

Deconstructing Datacenter Packet Transport describes how priority marking of packets associated with large flows can improve completion times for flows crossing the data center fabric. Simulation results presented in the paper show that prioritization of short flows over large flows can significantly improve throughput (reducing flow completion times by a factor of 5 or more at high loads).

This article demonstrates a self contained real-time Elephant flow marking solution that leverages the real-time visibility and control features available using commodity switch hardware.

The diagram shows the elements of the solution. An instance of the sFlow-RT real-time analytics engine receives streaming sFlow telemetry from a pair of edge routers. A mix of many small flows mixed with a few large flows arrive at the left router, all flows have the default Best Effort (be) Differentiated Services Code Point (DSCP) 0 marking (indicated in blue). As soon as a large flow is detected, a BGP Flowspec rule is pushed to the router, remarking the flow as Lower Effort (le) DSCP 1 (see RFC 8622: A Lower-Effort Per-Hop Behavior (LE PHB) for Differentiated Services).  The large flow is continuously monitored and the Flowspec rule is withdrawn when the flow ends.

The less than best effort class ensures that the large flow doesn't compete for bandwidth and buffer resources with the small flows, ensuring faster completion times and lower latency for time sensitive traffic while minimally impacting throughput of the large flow.

The following partial configuration enables sFlow and BGP Flowspec on an Arista EOS device (EOS 4.22 or later):
!
service routing protocols model multi-agent
!
sflow sample 16384
sflow polling-interval 30
sflow destination 10.0.0.70
sflow run
!
interface Ethernet1
   flow-spec ipv4 ipv6
!
interface Management1
   ip address 10.0.0.96/24
!
ip routing
!
ipv6 unicast-routing
!
router bgp 64497
   router-id 192.0.2.1
   neighbor 10.0.0.70 remote-as 65070
   neighbor 10.0.0.70 transport remote-port 1179
   neighbor 10.0.0.70 allowas-in 3
   neighbor 10.0.0.70 send-community extended
   neighbor 10.0.0.70 maximum-routes 12000 
   !
   address-family flow-spec ipv4
      neighbor 10.0.0.70 activate
   !
   address-family flow-spec ipv6
      neighbor 10.0.0.70 activate
   !
   address-family ipv4
      neighbor 10.0.0.70 activate
   !
   address-family ipv6
      neighbor 10.0.0.70 activate
!
The following sFlow-RT mark.js script implements the flow marking controller:
var routers = [
  {router:'10.0.0.96',agent:'10.0.0.170'},
  {router:'10.0.0.97',agent:'10.0.0.171'}
];
var my_as = '65030';
var my_id = '0.6.6.6';
var flow_t = 2;
var threshold_val = 10000000/8;
var threshold_t = 10;
var dscp_name = 'le';
var dscp_val = 1;
var enable_v6 = false;
var max_controls = 1000;

var controls = {};

var bgp_opts = {ipv6:enable_v6,flowspec:true,flowspec6:enable_v6};

function bgpClose(router) {
  var key, ctl;
  for(key in controls) {
    ctl = controls[key];
    if(ctl.router != router) continue;

    ctl.success = false;
  }
}
function bgpOpen(router) {
  var key, ctl;
  for(key in controls) {
    ctl = controls[key];
    if(ctl.router != router) continue;

    ctl.success = bgpAddFlow(ctl.router, ctl.flowspec);
  }
}
var agentToRouter = {};
var controlCount = {};
routers.forEach(function(rec) {
  bgpAddNeighbor(rec.router,my_as,my_id,bgp_opts,bgpOpen,bgpClose);
  agentToRouter[rec.agent] = rec.router || rec.agent;
  controlCount[rec.router] = 0;
});

setFlow('mark_tcp', {
  keys: 'ipsource,ipdestination,tcpsourceport,tcpdestinationport',
  value:'bytes',
  filter:'direction=ingress&ipprotocol=6&ipdscp!='+dscp_val,
  t:flow_t
});
setFlow('mark_tcp6', {
  keys: 'ip6source,ip6destination,tcpsourceport,tcpdestinationport',
  value:'bytes',
  filter:'direction=ingress&ip6nexthdr=6&ip6dscp!='+dscp_val,
  t:flow_t
});

setThreshold('mark_tcp', {
  metric:'mark_tcp',
  value:threshold_val,
  byFlow:true,
  timeout:threshold_t
});
setThreshold('mark_tcp6', {
  metric:'mark_tcp6',
  value:threshold_val,
  byFlow:true,
  timeout:threshold_t
});

setEventHandler(function(evt) {
  var router = agentToRouter[evt.agent];
  if(!router) {
    return;
  }

  var key = router + '-' + evt.flowKey;
  if(controls[key]) {
    return;
  }

  if(controlCount[router] >= max_controls) {
    return;
  }

  var [saddr,daddr,sport,dport] = evt.flowKey.split(',');
  var ctl = {
    key:key,
    router:router,
    event:evt,
    flowspec: {
      match: {
        source:saddr,
        destination:daddr,
        'source-port':'='+sport,
        'destination-port':'='+dport,
      },
      then: {
       'traffic-marking':dscp_name
      }
    }
  };
  switch(evt.eventID) {
    case 'mark_tcp':
      ctl.flowspec.match.version = '4';
      ctl.flowspec.match.protocol = '=6';
      break;
    case 'mark_tcp6':
      ctl.flowspec.match.version = '6';
      ctl.flowspec.match.protocol = '=6';
      break;
  }
  if(!enable_v6 && '6' == ctl.flowspec.match.version) {
    return;
  }

  ctl.success = bgpAddFlow(ctl.router, ctl.flowspec);
  controls[ctl.key] = ctl;
  controlCount[router]++;
  logInfo('mark add '+router+' '+evt.flowKey);
},['mark_tcp','mark_tcp6']);

setIntervalHandler(function(now) {
  var key, ctl, evt, triggered;
  for(key in controls) {
    ctl = controls[key];
    evt = ctl.event;
    if(thresholdTriggered(evt.thresholdID, evt.agent,
                          evt.dataSource+'.'+evt.metric,
                          evt.flowKey)) continue;

    if(ctl.success) bgpRemoveFlow(ctl.router,ctl.flowspec);
    delete controls[key];
    controlCount[ctl.router]--;
    logInfo('mark remove '+ctl.router+' '+ctl.event.flowKey);
  }
});
Some notes on the script:
  1. The routers array contains the set of BGP routers that are to be controlled. The router attribute specifies the IP address that will initiate the BGP connection and the agent attribute specifies the sFlow agent address of the router. 
  2. TCP connections exceeding the threshold_val of 10Mbit/s will be marked.
  3. The max_controls value of 1000 caps the number of Flowspec rules that can be installed in each router in order to avoid exceeding the capabilities of the hardware.
  4. The setFlow() function, see Defining Flows, tracks ingress TCP flows that haven't been marked as LE.
  5. The setThreshold() function defines a threshold to identify large unmarked flows.
  6. The setEventHandler() function triggers the marking action in response to a threshold event.
  7. The setIntervalHandler() function runs every second, finding large flows that have finished and removing their controls.
  8. See Writing Applications for more information.
The easiest way to run the script is to use Docker with the pre-built sflow/ddos-protect image. Running the following command on host 10.0.0.70 launches the controller:
docker run --net=host \
-v $PWD/mark.js:/sflow-rt/mark.js \
sflow/ddos-protect -Dscript.file=mark.js
Using iperf to generate a large flow to test the controller.
localhost#sh bgp flow-spec ipv4
BGP Flow Specification rules for VRF default
Router identifier 10.0.0.96, local AS number 65096
Rule status codes: # - not installed, M - received from multiple peers

   Matching Rule                                                Actions
   172.16.1.174/32;172.16.2.175/32;DP:=5001;SP:=39208;          Mark DSCP: 0x1
Command line output from the edge router confirms that the large flow has been detected and is being marked.

Note: Real-time DDoS mitigation using BGP RTBH and FlowSpec describes how DDoS attacks can be automatically mitigated in real-time using a control scheme very similar to the one described in this article. The Docker image used above includes the DDoS mitigation controller.

Wednesday, October 30, 2019

Observability in Data Center Networks


Observability in Data Center Networks: In this session, you’ll learn how the sFlow protocol provides broad visibility in modern data center environments as they migrate to highly meshed topologies. Our data center workloads are shifting to take advantage of higher speeds and bandwidth, so visibility to east-west traffic within the data center is becoming more important. Join Peter Phaal—one of the inventors of sFlow—and Joe Reves from SolarWinds product management as they discuss how sFlow differs from other flow instrumentation to deliver visibility in the switching fabric.
THWACKcamp is SolarWinds’ free, annual, worldwide virtual IT learning event connecting thousands of skilled IT professionals with industry experts and SolarWinds technical staff. This video was one of the sessions.

Thursday, November 16, 2017

RESTful control of Cumulus Linux ACLs

The diagram above shows how the Cumulus Linux 3.4 HTTP API can be extended to include the functionality described in REST API for Cumulus Linux ACLs. Fast programmatic control of Cumulus Linux ACLs addresses a number of interesting use cases, including: DDoS mitigation, Elephant flow marking, and Triggered remote packet capture using filtered ERSPAN.

The Github pphaal/acl_server project INSTALL page describes how to install the acl_server daemon and configure the NGINX web server front end for the Cumulus Linux REST API to include the acl_server functions. The integration ensures that the same access controls configured for the REST API apply to the acl_server functions, which appear under the /acl/ path.

The following examples demonstrate the REST API.

Create an ACL

curl -X PUT -H 'Content-Type:application/json' --data '["[iptables]","-A FORWARD --in-interface swp+ -d 10.10.100.10 -p udp --sport 53 -j DROP"]' -k -u 'cumulus:CumulusLinux!' https://10.0.0.52:8080/acl/ddos1
ACLs are sent as a JSON encoded array of strings. Each string will be written as a line in a file stored under /etc/cumulus/acl/policy.d/ - See Cumulus Linux: Netfilter - ACLs. For example, the rule above will be written to the file 50rest-ddos1.rules with the following content:
[iptables]
-A FORWARD --in-interface swp+ -d 10.10.100.10 -p udp --sport 53 -j DROP
This iptables rule blocks all traffic from UDP port 53 (DNS) to host 10.10.100.10. This is the type of rule that might be inserted to block a DNS amplification attack.

Retrieve an ACL

curl -k -u 'cumulus:CumulusLinux!' https://10.0.0.52:8080/acl/ddos1
Returns the result:
[
 "[iptables]", 
 "-A FORWARD --in-interface swp+ -d 10.10.100.10 -p udp --sport 53 -j DROP"
]

List ACLs

curl -k -u 'cumulus:CumulusLinux!' https://10.0.0.52:8080/acl/
Returns the result:
[
 "ddos1"
]

Delete an ACL

curl -X DELETE -k -u 'cumulus:CumulusLinux!' https://10.0.0.52:8080/acl/ddos1

Delete all ACLs

curl -X DELETE -k -u 'cumulus:CumulusLinux!' https://10.0.0.52:8080/acl/
Note: this doesn't delete all the ACLs, just the ones created using the REST API. All default ACLs or manually created ACLs are inaccessible through the REST API.

Errors

The acl_server batches and compiles changes after the HTTP requests complete. Batching has the benefit of increasing throughput and reducing request latency, but makes it difficult to track compilation errors since they are reported later. The acl_server catches the output and status when running cl-acltool and attaches an HTTP Warning header to subsequent responses to indicate that the last compilation failed:
HTTP/1.1 200 OK
Server: nginx/1.6.2
Date: Thu, 16 Nov 2017 21:38:03 GMT
Content-Type: application/json
Transfer-Encoding: chunked
Connection: keep-alive
Keep-Alive: timeout=300
Accept: application/json
Warning: 199 - "check lasterror"
The output of cl-acltool can be retrieved:
curl -k -u 'cumulus:CumulusLinux!' https://10.0.0.52:8080/acl/lasterror
Returns the result:
{"returncode": 255, "lines": [...]}
The REST API is intended to be used by automation systems and so syntax problems with the ACLs they generate should be rare and are the result of a software bug. A controller using this API should check responses for the presence of the last error Warning, log the lasterror information so that the problem can be debugged, and finally delete all the rules created through the REST API to restore the system to its default state.


While this REST API could be used as a convenient way to manually push an ACL to a switch, the API is intended to be part of automation solutions that combine real-time traffic analytics with automated control. Cumulus Linux includes standard sFlow measurement support, delivering real-time network wide visibility to drive solutions that include: DDoS mitigation, enforcing black lists, marking large flows, ECMP load balancing, packet brokers etc.

The acl_server functionality demonstrates the value of the open Linux environment exposed by Cumulus Linux, making it easy to extend the platform using standard Linux tools in order to address operational requirements. Download the free Cumulus Linux VX virtual machine to try these examples yourself.

Wednesday, September 27, 2017

Real-time visibility and control of campus networks

Many of the examples on this blog describe network visibility driven control of data center networks. However, campus networks face many similar challenges and the availability of industry standard sFlow telemetry and RESTful control APIs in campus switches make it possible to apply feedback control.

HPE Aruba has an extensive selection of campus switches that combine programmatic control via a REST API with hardware sFlow support:
  • Aruba 2530 
  • Aruba 2540 
  • Aruba 2620
  • Aruba 2930F
  • Aruba 2930M
  • Aruba 3810
  • Aruba 5400R
  • Aruba 8400
 This article presents an example of implementing quota controls using HPE Aruba switches.
Typically, a small number of hosts are responsible for the majority of traffic on the network: identifying those hosts, and applying controls to their traffic to prevent them from unfairly dominating, ensures fair access to all users.

Peer-to-peer protocols (P2P) pose some unique challenges:
  • P2P protocols make use of very large numbers of connections in order to quickly transfer data. The large number of connections allows a P2P user to obtain a disproportionate amount of network bandwidth; even a small number of P2P users (less than 0.5% of users) can consume over 90% of the network bandwidth.
  • P2P protocols (and users) are very good at getting through access control lists (acl) by using non-standard ports, using port 80 (web) etc. Trying to maintain an effective filter to identify P2P traffic is a challenge and the resulting complex rule sets consume significant resources in devices attempting to perform classification.
In this example, all switches are configured to stream sFlow telemetry to an instance of the sFlow-RT real-time sFlow analyzer running a quota controller. When a host exceeds its traffic quota, a REST API call is made to the host's access switch, instructing the switch to mark the host's traffic as low priority. Marking the traffic ensures that if congestion occurs elsewhere in the network, typically on the Internet access links, priority queuing will cause marked packets can be dropped, reducing the bandwidth consumed by the marked host. The quota controller continues to monitor the host and the marking action is removed when the host's traffic returns to acceptable levels.

A usage quota is simply a limit on the amount of traffic that a user is allowed to generate in a given amount of time. Usage quotas have a number of attributed that make them an effective means of managing P2P activity:
  • A simple usage quota is easy to maintain and enforce and encourages users to be more responsible in their use of shared resources.
  • Since quota based controls are interested in the overall amount of traffic that a host generates and not the specific type of traffic, they don't encourage users to tailor P2P application setting to bypass access control rules and so their traffic is easier to monitor.
  • A quota system can be implemented using standard network hardware, without the addition of a "traffic shaping" appliance that can become a bottleneck and point of failure.
The following quota.js script implements the quota controller functionality:
var user = 'manager';
var password = 'manager';
var scheme = 'http://';
var mbps = 10;
var interval = 10;
var timeout = 20;
var dscp = '10';
var groups = {'ext':['0.0.0.0/0'],'inc':['10.0.0.0/8'],'exc':['10.1.0.0/16']};

function runCmd(agent,cmd) {
  var headers = {'Content-Type':'application/json','Accept':'application/json'};
  // create session
  var auth = http2({
    url:scheme+agent+'/rest/v3/login-sessions',
    operation:'post',
    headers:headers,
    body: JSON.stringify({userName:user, password:password})
  });
  headers['Cookie']=JSON.parse(auth.body).cookie;

  // make request
  var resp = http2({
    url:scheme+agent+'/rest/v3/cli',
    operation:'post',
    headers:headers,
    body: JSON.stringify({cmd:cmd})
  });
  var result = base64Decode(JSON.parse(resp.body).result_base64_encoded);

  // end session
  var end = http2({
    url:scheme+agent+'/rest/v3/login-sessions',
    operation:'delete',
    headers:headers
  });
  return result;
}

setGroups('site',groups);

setFlow('src', {
  keys:'ipsource',
  value:'bytes',
  filter:'direction=ingress&group:ipsource:site=inc&group:ipdestination:site=ext',
  t:interval
});

setThreshold('quota', {
  metric:'src',
  value:mbps*1000000/8,
  byFlow: true,
  timeout:timeout,
  filter:{ifspeed:[10000000,100000000,1000000000]}
});

var controls = {};
setEventHandler(function(evt) {
  var ip = evt.flowKey;
  if(controls[ip]) return;

  var agent = evt.agent;
  var ds = evt.dataSource;
  controls[ip] = {agent:agent,ds:ds,time:Date.now()};
  logInfo('mark '+ip+' agent '+agent);
  try { runCmd(agent,'qos device-priority '+ip+' dscp '+dscp); }
  catch(e) { logWarning('runCmd error ' + e); }
}, ['quota']);

setIntervalHandler(function() {
  for(var ip in controls) {
    var ctl = controls[ip];
    if(thresholdTriggered('quota',ctl.agent,ctl.ds+'.src',ip)) continue;

    logInfo('unmark '+ip+' agent '+ctl.agent);
    try { runCmd(ctl.agent,'no qos device-priority '+ip); }
    catch(e) { logWarning('runCmd error ' + e); }
    delete controls[ip];
  }
});
Some notes on the script:
  • Writing Applications provides an overview of the sFlow-RT scripting API.
  • HPE ArubaOS-Switch REST API and JSON Schema Reference Guide 16.03 describes the REST API calls in the runCmds() function.
  • The groups variable defines groups of IP addresses, identifying external addresses (ext), addresses included as candidates for the quota controller (inc), and addresses excluded from quota controls (exc).
  • Defining Flows describes the arguments to the setFlow() function. In this case, calculating a 10 second moving average of traffic from local sources (inc) to external destinations (ext).
  • The setThreshold() function creates a threshold that triggers if the moving average of traffic from an address exceeds 10Mbit/s. The thresholds are only applied to 10M, 100M and 1G access ports, ensuring that controls are only applied to access layer switches and not to 10G ports on aggregation and core switches.
  • The setEventHandler() function processes the events, keeping track of existing controls and implementing new DSCP marking rules.
  • The setIntervalHandler() function runs periodically and removes marking rules when they are not longer required (after the threshold timeout has expired).
  • The ArubaOS commands to add / remove DSCP marking for the host are highlighted in blue.
The easiest way to try out the script is to use Docker to run sFlow-RT:
docker run -v $PWD/cli.js:/sflow-rt/quota.js -e "RTPROP=-Dscript.file=quota.js" -p 6343:6343/udp -p 8008:8008 sflow/sflow-rt
2017-09-27T02:32:14+0000 INFO: Listening, sFlow port 6343
2017-09-27T02:32:14+0000 INFO: Listening, HTTP port 8008
2017-09-27T02:32:14+0000 INFO: quota.js started
2017-09-27T02:33:53+0000 INFO: mark 10.0.0.70 agent 10.0.0.232
2017-09-27T02:34:25+0000 INFO: unmark 10.0.0.70 agent 10.0.0.232
The output indicates that a control marking traffic from 10.0.0.70 was added to edge switch 10.0.0.232 and removed just over 30 seconds later.
The screen capture using Flow Trend to monitor the core switches shows the controller in action. The marking rule is added as soon as traffic from 10.0.0.70 exceeds the 10Mbps quota for 10 seconds (the DSCP marking shown in the chart changes from red be(0) to blue af11(10)). The marking rule is removed once the traffic returns to normal.
The quota settings in the demonstration were aggressive. In practice the threshold settings would be higher and the timeouts longer in order to minimize control churn. The trend above was collected from a university network of approximately 20,000 users that implemented a similar control scheme. In this case, the quota controller was able to consistently mark 50% of the traffic as low priority. Between 10 and 20 controls were in place at any given time and the controller made around 10 control changes an hour (adding or removing a control). During busy periods, congestion on the campus Internet access links was eliminated since marked traffic could be discarded when necessary.

Implementing usage quotas is just one example of applying measurement based control to a campus network. Other interesting applications include:
Real-time measurement and programmatic APIs are becoming standard features of campus switches, allowing visibility driven automatic control to adapt the network to changing network demands and security threats.

Sunday, August 27, 2017

Cumulus Linux 3.4 REST API

The latest Cumulus Linux 3.4 release include a REST API. This article will demonstrate how the REST API can be used to automatically deploy traffic controls based on real-time sFlow telemetry. DDoS mitigation with Cumulus Linux describes how sFlow-RT can detect Distributed Denial of Service (DDoS) attacks in real-time and deploy automated controls.

The following ddos.js script is modified to use the REST API to send Network Command Line Utility - NCLU commands to add and remove ACLs, see Installing and Managing ACL Rules with NCLU:
var user = "cumulus";
var password = "CumulusLinux!";
var thresh = 10000;
var block_minutes = 1;

setFlow('udp_target',{keys:'ipdestination,udpsourceport',value:'frames'});

setThreshold('attack',{metric:'udp_target', value:thresh, byFlow:true, timeout:10});

function restCmds(agent,cmds) {
  for(var i = 0; i < cmds.length; i++) {
    let msg = {cmd:cmds[i]};
    http("https://"+agent+":8080/nclu/v1/rpc",
         "post","application/json",JSON.stringify(msg),user,password);
  }
}

var controls = {};
var id = 0;
setEventHandler(function(evt) {
  var key = evt.agent + ',' + evt.flowKey;
  if(controls[key]) return;

  var ifname = metric(evt.agent,evt.dataSource+".ifname")[0].metricValue;
  if(!ifname) return;

  var now = (new Date()).getTime();
  var name = 'ddos'+id++;
  var [ip,port] = evt.flowKey.split(',');
  var cmds = [
    'add acl ipv4 '+name+' drop udp source-ip any source-port '+port+' dest-ip '+ip+' dest-port any',
    'add int '+ifname+' acl ipv4 '+name+' inbound',
    'commit'
  ];
  controls[key] = {time:now, target: ip, port: port, agent:evt.agent, metric:evt.dataSource+'.'+evt.metric, key:evt.flowKey, name:name};
  try { restCmds(evt.agent, cmds); }
  catch(e) { logSevere('failed to add ACL, '+e); }
  logInfo('block target='+ip+' port='+port+' agent=' + evt.agent); 
},['attack']);

setIntervalHandler(function() {
  var now = (new Date()).getTime();
  for(var key in controls) {
    if(now - controls[key].time < 1000 * 60 * block_minutes) continue;
    var ctl = controls[key];
    if(thresholdTriggered('attack',ctl.agent,ctl.metric,ctl.key)) continue;

    delete controls[key];
    var cmds = [
      'del acl ipv4 '+ctl.name,
      'commit'
    ];
    try { restCmds(ctl.agent,cmds); }
    catch(e) { logSevere('failed to remove ACL, ' + e); }
    logInfo('allow target='+ctl.target+' port='+ctl.port+' agent='+ctl.agent);
  }
});
The quickest way test the script is to use docker to run sFlow-RT:
docker run -v $PWD/ddos.js:/sflow-rt/ddos.js \
-e "RTPROP=-Dscript.file=ddos.js -Dhttp.timeout.read=60000" \
-p 6343:6343/udp -p 8008:8008 sflow/sflow-rt
This solution can be tested using freely available software. The setup shown at the top of this article was constructed using a Cumulus VX virtual machine running on VirtualBox.  The Attacker and Target virtual machines are Linux virtual machines used to simulate the DDoS attack.

A DNS amplification attack can be simulated using hping3. Run the following command on the Attacker host:
sudo hping3 --flood --udp -k -s 53 192.168.2.1
Run tcpdump on the Target host to see if the attack is getting through:
sudo tcpdump -i eth1 udp port 53
Each time an attack is launched a new ACL will be added that matches the attack signature and drops the traffic. The ACL is kept in place for at least block_minutes and removed once the attack ends. The following sFlow-RT log messages show the results:
2017-08-26T17:01:24+0000 INFO: Listening, sFlow port 6343
2017-08-26T17:01:24+0000 INFO: Listening, HTTP port 8008
2017-08-26T17:01:24+0000 INFO: ddos.js started
2017-08-26T17:03:07+0000 INFO: block target=192.168.2.1 port=53 agent=10.0.0.61
2017-08-26T17:03:49+0000 INFO: allow target=192.168.2.1 port=53 agent=10.0.0.61
REST API for Cumulus Linux ACLs describes the acl_server daemon that was used in the original article. The acl_server daemon is optimized for real-time performance, supporting use cases in which multiple traffic controls need to be quickly added and removed, e.g  DDoS mitigation, marking large flows, ECMP load balancing, packet brokers.

A key benefit of the openness of Cumulus Linux is that you can install software to suite your use case, other examples include: BGP FlowSpec on white box switch, Internet router using Cumulus Linux, Topology discovery with Cumulus Linux, Black hole detection, and Docker networking with IPVLAN and Cumulus Linux.

Wednesday, July 12, 2017

Arista eAPI

The sFlow and eAPI features of EOS (Extensible Operating System) are standard across the full range of Arista Networks switches. This article demonstrates how the real-time visibility provided by sFlow telemetry can be combined with the programmatic control of eAPI to automatically adapt the network to changing traffic conditions.

In the diagram, the sFlow-RT analytics engine receives streaming sFlow telemetry, provides real-time network-wide visibility, and automatically applies controls using eAPI to optimize forwarding, block denial of service attacks, or capture suspicious traffic.

Arista eAPI 101 describes the JSON RPC interface for programmatic control of Arista switches. The following eapi.js script shows how eAPI requests can be made using sFlow-RT's JavaScript API:
function runCmds(proto, agent, usr, pwd, cmds) {
  var req = {
    jsonrpc:'2.0',id:'sflowrt',method:'runCmds',
    params:{version:1,cmds:cmds,format:'json'}
  };
  var url = (proto || 'http')+'://'+agent+'/command-api';
  var resp = http(url,'post','application/json',JSON.stringify(req),usr,pwd);
  if(!resp) throw "no response";
  resp = JSON.parse(resp);
  if(resp.error) throw resp.error.message;
  return resp.result; 
}
The following test.js script demonstrates the eAPI functionality with a basic show request:
include('eapi.js');
var result = runCmds('http','10.0.0.90','admin','arista',['show hostname']);
logInfo(JSON.stringify(result));
Starting sFlow-RT:
env "RTPROP=-Dscript.file=test.js" ./start.sh
Running the script generates the following output:
2017-07-10T14:00:06-0700 INFO: Listening, sFlow port 6343
2017-07-10T14:00:06-0700 INFO: Listening, HTTP port 8008
2017-07-10T14:00:06-0700 INFO: test.js started
2017-07-10T14:00:06-0700 INFO: [{"fqdn":"leaf1","hostname":"leaf1"}]
2017-07-10T14:00:06-0700 INFO: test.js stopped
While retrieving information from the switch is useful, reconfiguring the switch based on real-time sFlow telemetry is much more interesting.

DDoS describes how sFlow analytics can be used to detect distributed denial of service (DDoS) attacks in real-time. EOS DirectFlow provides a flexible method of applying traffic controls and the following ddos.js script automatically detects UDP reflection/amplification attacks and uses eAPI to install DirectFlow entries to drop the attack traffic:
include('eapi.js');

var proto = 'http';
var user = 'admin';
var password = 'arista';
var thresh = 1000000;
var block_minutes = 60;

setFlow('udp_target',{keys:'ipdestination,udpsourceport',value:'frames'});

setThreshold('attack',{metric:'udp_target', value:thresh, byFlow:true});

var controls = {};
var id = 0;
setEventHandler(function(evt) {
  var key = evt.agent + ',' + evt.flowKey;
  if(controls[key]) return;

  var now = (new Date()).getTime();
  var flow = 'ddos'+id++;
  var [ip,port] = evt.flowKey.split(',');
  var cmds = [
  'enable',
  'configure',
  'directflow',
  'flow ' + flow,
  'match ethertype ip',
  'match destination ip ' + ip,
  'match ip protocol udp',
  'match source port ' + port, 
  'action drop'
  ];
  controls[key] = {time:now, target: ip, port: port, agent:evt.agent, flow:flow};
  try { runCmds(proto,evt.agent,user,password,cmds); }
  catch(e) { logSevere('failed to add filter, ' + e); }
  logInfo('block target='+ip+' port='+port+' agent=' + evt.agent);  
},['attack']);

setIntervalHandler(function() {
  var now = (new Date()).getTime();
  for(var key in controls) {
    if(now - controls[key].time < 1000 * 60 * block_minutes) continue;
    var ctl = controls[key];
    delete controls[key];
    var cmds = [
    'enable',
    'configure',
    'directflow',
    'no flow ' + ctl.flow
    ];
    try { runCmds(proto,ctl.agent,user,password,cmds); }
    catch(e) { logSevere('failed to remove filter, ' + e); }
    logInfo('allow target='+ctl.target+' port='+ctl.port+' agent='+ctl.agent);
  }
});
Some notes on the script:
  • The script is designed to work with a large number of switches, automatically applying the DirectFlow filter to the switch reporting the traffic.
  • The udp_target flow identifies the IP address targeted by the attack and the UDP source port of service being used to reflect/amplify traffic. 
  • A threshold of 1,000,000 frames per second is used to trigger an event.
  • The setEventHandler function extracts target IP address, and UDP source port from the event and uses eAPI to push a DirectFlow filter to switch (agent) identified in the event.
  • The setIntervalHandler function is responsible for removing controls after 60 minutes.
  • The script can easily be modified to use eAPI to gather additional metadata. For example, to identify leaf switches and limit filters to the edge of the network.
  • Exporting events using syslog shows how notifications can be sent to SIEM tools, e.g. Splunk, Logstash, etc.
  • InfluxDB and Grafana, Metric export to Graphite, Cloud analytics, and SignalFx, demonstrate how metrics can be pushed to local and/or cloud-based dashboards.
  • See Writing Applications for more information on sFlow-RT scripting and APIs.
The basic steps of defining a flow, setting a threshold, and then acting on events embodied in this example provide a general framework that can be applied to a wide variety of use cases: SDN and large flows, Marking large flows, SDN packet broker etc. In addition to DirectFlow, other useful EOS eAPI controls include: ACLs, route maps, static routes, null routes, packet capture etc.

Industry standard sFlow telemetry unlocks the full potential of programmable networking platforms such as Arista EOS, providing the visibility required to automatically target controls and adapt the network in real-time to changing network conditions to increase performance, reduce cost, and improve security.

Tuesday, September 27, 2016

Docker 1.12 swarm mode elastic load balancing


Docker Built-In Orchestration Ready For Production: Docker 1.12 Goes GA describes the native swarm mode feature that integrates cluster management, virtual networking, and policy based deployment of services.

This article will demonstrate how real-time streaming telemetry can be used to construct an elastic load balancing solution that dynamically adjusts service capacity to match changing demand.

Getting started with swarm mode describes the steps to configure a swarm cluster. For example, following command issued on any of the Manager nodes deploys a web service on the cluster:
docker service create --replicas 2 -p 80:80 --name apache httpd:2.4
And the following command raises the number of containers in the service pool from 2 to 4:
docker service scale apache=4
Asynchronous Docker metrics describes how sFlow telemetry provides the real-time visibility required for elastic load balancing. The diagram shows how streaming telemetry allows the sFlow-RT controller to determine the load on the service pool so that it can use the Docker service API to automatically increase or decrease the size of the pool as demand changes. Elastic load balancing of the service pools ensures consistent service levels by adding additional resources if demand increases. In addition, efficiency is improved by releasing resources when demand drops so that they can be used by other services. Finally, global visibility into all resources and services makes it possible to load balance between services, reducing service pools for non-critical services to release resources during peak demand.

The first step is to install and configure Host sFlow agents on each of the nodes in the Docker swarm cluster. The following /etc/hsflowd.conf file configures Host sFlow to monitor Docker and send sFlow telemetry to a designated collector (in this case 10.0.0.162):
sflow {
  sampling = 400
  polling = 10
  collector { ip = 10.0.0.162 } 
  docker { }
  pcap { dev = docker0 }
  pcap { dev = docker_gwbridge }
}
Note: The configuration file is identical for all nodes in the cluster making it easy to automate the installation and configuration of sFlow monitoring using  Puppet, Chef, Ansible, etc.

Verify that the sFlow measurements are arriving at the collector node (10.0.0.162) using sflowtool:
docker -p 6343:6343/udp sflow/sflowtool
The following elb.js script implements elastic load balancer functionality using the sFlow-RT real-time analytics engine:
var api = "https://10.0.0.134:2376";
var certs = '/tls/';
var service = 'apache';

var replicas_min = 1;
var replicas_max = 10;
var util_min = 0.5;
var util_max = 1;
var bytes_min = 50000;
var bytes_max = 100000;
var enabled = false;

function getInfo(name) {
  var info = null;
  var url = api+'/services/'+name;
  try { info = JSON.parse(http2({url:url, certs:certs}).body); }
  catch(e) { logWarning("cannot get " + url + " error=" + e); }
  return info;
}

function setReplicas(name,count,info) {
  var version = info["Version"]["Index"];
  var spec = info["Spec"];
  spec["Mode"]["Replicated"]["Replicas"]=count;
  var url = api+'/v1.24/services/'+info["ID"]+'/update?version='+version;
  try {
    http2({
      url:url, certs:certs, method:'POST',
      headers:{'Content-Type':'application/json'},
      body:JSON.stringify(spec)
    });
  }
  catch(e) { logWarning("cannot post to " + url + " error=" + e); }
  logInfo(service+" set replicas="+count);
}

var hostpat = service+'\\.*';
setIntervalHandler(function() {
  var info = getInfo(service);
  if(!info) return;

  var replicas = info["Spec"]["Mode"]["Replicated"]["Replicas"];
  if(!replicas) {
    logWarning("no active members for service=" + service);
    return;
  }

  var res = metric(
    'ALL', 'avg:vir_cpu_utilization,avg:vir_bytes_in,avg:vir_bytes_out',
    {'vir_host_name':[hostpat],'vir_cpu_state':['running']}
  );

  var n = res[0].metricN;

  // we aren't seeing all the containers (yet)
  if(replicas !== n) return;

  var util = res[0].metricValue;
  var bytes = res[1].metricValue + res[2].metricValue;

  if(!enabled) return;

  // load balance
  if(replicas < replicas_max && (util > util_max || bytes > bytes_max)) {
    setReplicas(service,replicas+1,info);
  }
  else if(replicas > replicas_min && util < util_min && bytes < bytes_min) {
    setReplicas(service,replicas-1,info);
  }
},2);

setHttpHandler(function(req) {
  enabled = req.query && req.query.state && req.query.state[0] === 'enabled';
  return enabled ? "enabled" : "disabled";
});
Some notes on the script:
  1. The setReplicas(name,count,info) function uses the Docker Remote API to implement functionality equivalent to the docker service scale name=count command shown earlier. The REST API is accessible at https://10.0.0.134:2376 in this example.
  2. The setIntervalHandler() function runs every 2 seconds, retrieving metrics for the service pool and scaling the number of replicas in the service up or down based on thresholds.
  3. The setHttpHandler() function exposes a simple REST API for enabling / disabling the load balancer functionality. The API can easily be extended to all thresholds to be set, to report statistics, etc.
  4. Certificates, key.pem, cert.pem, and ca.pem, required to authenticate API requests must be present in the /tls/ directory.
  5. The thresholds are set to unrealistically low values for the purpose of this demonstration.
  6. The script can easily be extended to load balance multiple services simultaneously.
  7. Writing Applications provides additional information on sFlow-RT scripting.
Run the controller:
docker run -v `pwd`/tls:/tls -v `pwd`/elb.js:/sflow-rt/elb.js \
 -e "RTPROP=-Dscript.file=elb.js" -p 8008:8008 -p 6343:6343/udp -d sflow/sflow-rt
The autoscaling functionality can be enabled:
curl "http://localhost:8008/script/elb.js/json?state=enabled"
and disabled:
curl "http://localhost:8008/script/elb.js/json?state=disabled"
using the REST API exposed by the script.
The chart above shows the results of a simple test to demonstrate the elastic load balancer function. First, ab - Apache HTTP server benchmarking tool was used to generate load on the apache service running under Docker swarm:
ab -rt 60 -n 300000 -c 4 http://10.0.0.134/
Next, the test was repeated with the elastic load balancer enabled. The chart clearly shows that the load balancer is keeping the average network load on each container under control.
2016-09-24T00:57:10+0000 INFO: Listening, sFlow port 6343
2016-09-24T00:57:10+0000 INFO: Listening, HTTP port 8008
2016-09-24T00:57:10+0000 INFO: elb.js started
2016-09-24T01:00:17+0000 INFO: apache set replicas=2
2016-09-24T01:00:23+0000 INFO: apache set replicas=3
2016-09-24T01:00:27+0000 INFO: apache set replicas=4
2016-09-24T01:00:33+0000 INFO: apache set replicas=5
2016-09-24T01:00:41+0000 INFO: apache set replicas=6
2016-09-24T01:00:47+0000 INFO: apache set replicas=7
2016-09-24T01:00:59+0000 INFO: apache set replicas=8
2016-09-24T01:01:29+0000 INFO: apache set replicas=7
2016-09-24T01:01:33+0000 INFO: apache set replicas=6
2016-09-24T01:01:35+0000 INFO: apache set replicas=5
2016-09-24T01:01:39+0000 INFO: apache set replicas=4
2016-09-24T01:01:43+0000 INFO: apache set replicas=3
2016-09-24T01:01:45+0000 INFO: apache set replicas=2
2016-09-24T01:01:47+0000 INFO: apache set replicas=1
The sFlow-RT log shows that containers are added to the apache service to handle the increased load and removed once demand decreases.

This example relied on a small subset of the information available from the sFlow telemetry stream. In addition to container resource utilization, the Host sFlow agent exports an extensive set of metrics from the nodes in the Docker swarm cluster. If the nodes are virtual machines running in a public or private cloud, the metrics can be used to perform elastic load balancing of the virtual machine pool making up the cluster, increasing the cluster size if demand increases and reducing cluster size when demand decreases. In addition, poorly performing instances can be detected and removed from the cluster (see Stop thief! for an example).
The sFlow agents also efficiently report on traffic flowing within and between microservices running on the swarm cluster. For example, the following command:
docker run -p 6343:6343/udp -p 8008:8008 -d sflow/top-flows
launches the top-flows application to show an up to the second view of active flows in the network.

Comprehensive real-time analytics is critical to effectively managing agile container-bases infrastructure. Open source Host sFlow agents provide a lightweight method of instrumenting the infrastructure that unifies network and system monitoring to deliver a full set of standard metrics to performance management applications.

Thursday, June 2, 2016

OVS Orbit podcast with Ben Pfaff

OVS Orbit Episode 6 is a wide ranging discussion between Ben Pfaff and Peter Phaal of the industry standard sFlow measurement protocol, implementation of sFlow in Open vSwitch, network analytics use cases and application areas supported by sFlow, including: OpenStack, Open Network Virtualization (OVN), DDoS mitigation, ECMP load balancing, Elephant and Mice flows, Docker containers, Network Function Virtualization (NFV), and microservices.

Follow the link to see listen to the podcast, read the extensive show notes, follow related links, and to subscribe to the podcast.

Monday, May 18, 2015

Analytics and SDN

Recent presentations from AT&T and Google describe SDN/NFV architectures that incorporate measurement based feedback in order to improve performance and reliability.

The first slide is from a presentation by AT&T's Margaret Chiosi; SDN+NFV Next Steps in the Journey, NFV World Congress 2015. The future architecture envisions generic (white box) hardware providing a stream of analytics which are compared to policies and used to drive actions to assure service levels.


The second slide is from the presentation by Google's Bikash Koley at the Silicon Valley Software Defined Networking Group Meetup. In this architecture, "network state changes observed by analyzing comprehensive time-series data stream." Telemetry is used to verify that the network is behaving as intended, identifying policy violations so that the management and control planes can apply corrective actions. Again, the software defined network is built from commodity white box switches.

Support for standard sFlow measurements is almost universally available in commodity switch hardware. sFlow agents embedded within network devices continuously stream measurements to the SDN controller, supplying the analytics component with the comprehensive, scaleable, real-time visibility needed for effective control.

SDN fabric controller for commodity data center switches describes the measurement and control capabilities available in commodity switch hardware. In addition, there are a number of use cases described on this blog that demonstrate the benefits of incorporating traffic analytics in SDN solutions, including:
While the incorporation of telemetry / analytics in SDN architectures is recent, the sFlow measurement standard is a proven technology that has been incorporated in switch ASICs for over a decade. Incorporating sFlow in SDN solution stacks leverages the capabilities of commodity switches to provide immediate visibility into operational networks without the complexity and cost of adding probes or being locked in to vendor specific hardware.

Wednesday, April 1, 2015

Big Tap sFlow: Enabling Pervasive Flow-level Visibility


Today's Big Switch Networks webinar, Big Tap sFlow: Enabling Pervasive Flow-level Visibility, describes how Big Switch uses software defined networking (SDN) to control commodity switches and deliver network visibility. The webinar presents a live demonstration showing how real-time sFlow analytics is used to automatically drive SDN actions to provide a "smarter way to find a needle in a haystack."

The video presentation covers the following topics:

  • 0:00 Introduction to Big Tap
  • 7:00 sFlow generation and use cases
  • 12:30 Demonstration of real-time tap triggering based on sFlow

The webinar describes how the network wide monitoring provided by industry standard sFlow instrumentation complements the Big Tap SDN controller's ability to capture and direct packet selected packet streams to visibility tools.

The above slide from the webinar draws an analogy for the role that sFlow plays in targeting the capture network to that of a finderscope, the small, wide-angle telescope used to provide an overview of the sky and guide the telescope to its target. Support for the sFlow measurement standard is built into commodity switch hardware and is enabled on all ports in the capture network to provide a wide angle view of all traffic in the data center. Once suspicious activity is detected, targeted captures can be automatically triggered using Big Tap's REST API.
Blacklists are an important way in which the Internet community protects itself by identifying bad actors. Incorporating blacklists in traffic monitoring can be a useful way to find hosts on a network that have been compromised. If a host interacts with addresses known to be part of a botnet for example, then it raises the concern that the host has been compromised and is itself a member of the botnet.

Black lists can be very large, larger lists can exceed a million addresses. Switches don't have the resources to match traffic against such large lists. However, sFlow shifts analysis from the switches to external software which can easily handle to task of matching traffic against large lists. The live demonstration uses InMon's sFlow-RT real-time analytics software to match sFlow data against a large blacklist.  When a match is detected the Big Tap controller is programmed via a REST API call to capture all the packets from the suspected hosts and stream them to Wireshark for further investigation.