Showing posts with label data center. Show all posts

Monday, February 23, 2026

Real-time visualization of AI / ML traffic matrix

Heatmap is available on GitHub. The application provides a real-time traffic matrix visualization of end-to-end traffic flowing across an Ethernet fabric. Each axis represents an ordered list of network addresses. The x-axis is a flow source and the y-axis is a flow destination.

For example, the Heatmap above comes from a large high performance compute cluster running a mixture of tasks. Traffic is concentrated along the diagonal, indicating that the job scheduler is packing related tasks in racks so that most traffic is confined to the rack.

Note: Live Dashboards links to a number dashboards showing live traffic, including the Heatmap above.

The next Heatmap shows a very different traffic pattern. In this case, RoCEv2 traffic generated by GPUs performing a NCCL AllReduce/AllGather collective operation using a ring algorithm. During the collective operation, each GPU sends data to its immediate neighbor (modulo the number of GPUs) in a logical ring, resulting in two nearly continuous lines on either size of the diagonal: one for forward traffic, and the other for return traffic associated with each flow.
The final example comes from a large data center hosting a mix of front end workloads. Unlike the backend networks, this network combines internal (East/West) traffic with external (North/South) traffic flows. The internal traffic flows are contained in the central grid. The surrounding borders display external traffic.
The full range of IP addresses (0.0.0.0 - 255.255.255.255) is displayed on the heatmap using a piecewise linear scaling function. A start and end address identifies internal traffic and maps to values in the central grid and addresses outside this range are scaled to fit in the borders insets.

Representing the traffic matrix in the form of a heat map scales well to very large networks and provides real-time insight into shifting traffic patterns as workloads change. The industry standard sFlow instrumentation in data center switches used to construct the traffic matrix also scales to the large number of switches and 400/800G port speeds found in AI/ML backend networks.

Monday, November 25, 2024

Topology aware flow analytics with NVIDIA NetQ

NVIDIA Cumulus Linux 5.11 for AI / ML describes how NVIDIA 400/800G Spectrum-X switches combined with the latest Cumulus Linux release deliver enhanced real-time telemetry that is particularly relevant to the AI / machine learning workloads that Spectrum-X switches are designed to handle.

This article shows how to extract Topology from an NVIDIA fabric in order to perform advanced fabric aware analytics, for example: detect flow collisions, trace flow paths, and de-duplicate traffic.

In this example, we will use NVIDIA NetQ, a highly scalable, modern network operations toolset that provides visibility, troubleshooting, and validation of your Cumulus and SONiC fabrics in real time.

netq show lldp json
For example, the NetQ Link Layer Discovery Protocol (LLDP) service simplifies the task of gathering neighbor data from switches in the network, and with the json option, makes the output easy to process with a Python script, for example, lldp-rt.py.

The simplest way to try sFlow-RT is to use the pre-built sflow/topology Docker image that packages sFlow-RT with additional applications that are useful for monitoring network topologies.

docker run -p 6343:6343/udp -p 8008:8008 sflow/topology
Configure Cumulus Linux to steam sFlow telemetry to sFlow-RT on UDP port 6343 (the default for sFlow).
netq show lldp json | ./lldp-rt.py http://sflow-rt:8008/topology/json
The above command puts it all together, taking LLDP data from NetQ, converting it to sFlow-RT format, and posting the fabric topology to the sFlow-RT REST API.
Access the sFlow-RT web interface on port 8008. The Topology application includes a dashboard to verify that all the nodes and links in the topology are fully covered by the sFlow telemetry stream.

Getting Started is a step by step guide to sFlow-RT applications, APIs, and community support.

Monday, November 18, 2024

NVIDIA Cumulus Linux 5.11 for AI / ML


NVIDIA Cumulus Linux 5.11 includes major upgrades to the sFlow agent that fully exposes the advanced instrumentation built into NVIDIA Spectrum-X silicon. The enhanced real-time telemetry is particularly relevant to the AI / machine learning workloads that Spectrum-X is designed to handle.

With Cumulus Linux 5.11, the sFlow agent is easily configured using nvue commands, see Monitoring System Statistics and Network Traffic with sFlow:

nv set system sflow dropmon hw
nv set system sflow poll-interval 20
nv set system sflow collector 192.0.2.1
nv set system sflow state enabled
nv config apply

Note: In this case, enabling dropmon ensures that every dropped packet is captured, along with ingress port and drop reason (e.g. ttl_exceeded).

The same commands should be applied to every switch in the fabric for comprehensive visibility.

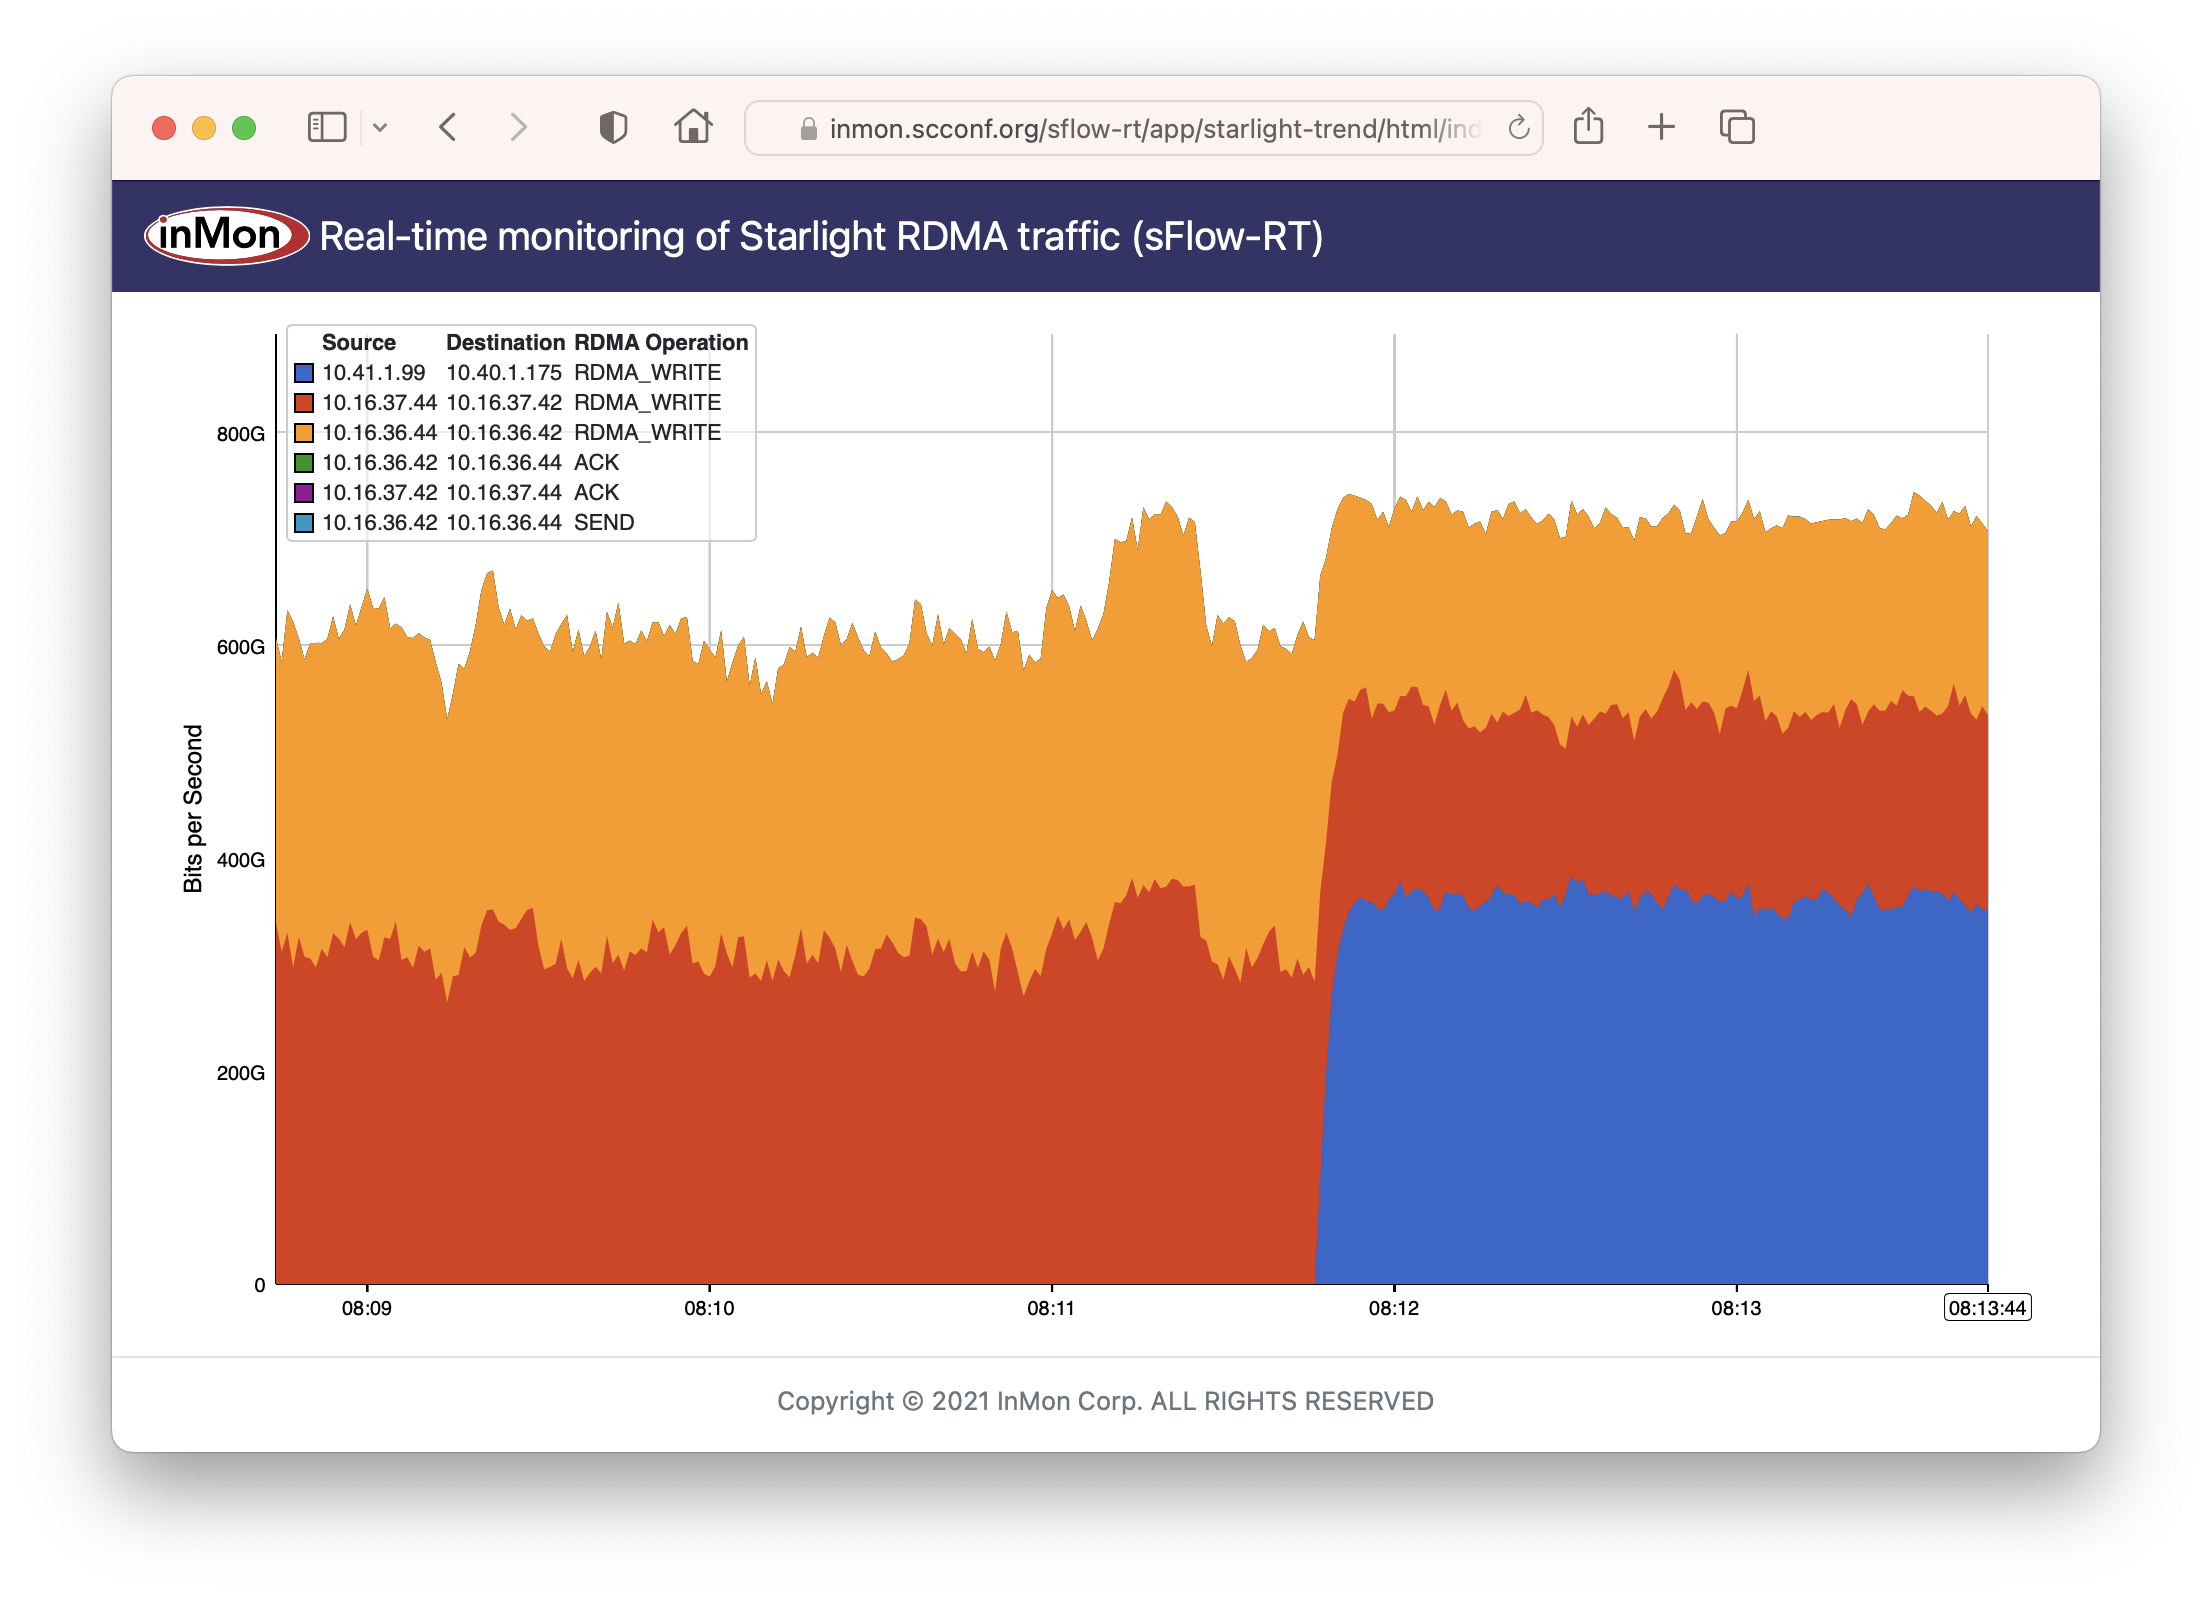
RDMA over Converged Ethernet (RoCE) describes how sFlow provides detailed visibility into RoCE flows used to move data between GPUs in an AI / ML data center fabric. The chart above from the RDMA network visibility demonstration at the SC22 conference shows that sFlow monitoring easily scales to the 400/800G speeds needed for machine learning.
In this example, the sFlow-RT real-time analytics engine receives sFlow telemetry from all the switches and servers in the fabric. Deploy real-time network dashboards using Docker compose describes how to quickly set up an sFlow-RT, Prometheus, Grafana stack to capture and display metrics. Dropped packet metrics with Prometheus and Grafana describes how to add a dashboard to display packet drop notifications.

If you are standing up a new NVIDIA Spectrum-X / Cumulus Linux network, enable sFlow on all the switches and set up an instance of sFlow-RT for the real-time fabric wide visibility into traffic flows and dropped packets. Real-time network visibility is particularly relevant to AI / ML data center networks where congestion and dropped packets can result in serious performance degradation.

Monday, March 7, 2022

Who monitors the monitoring systems?

Adrian Cockroft poses an interesting question in, Who monitors the monitoring systems? He states, The first thing that would be useful is to have a monitoring system that has failure modes which are uncorrelated with the infrastructure it is monitoring. ... I don’t know of a specialized monitor-of-monitors product, which is one reason I wrote this blog post.

This article offers a response, describing how to introduce an uncorrelated monitor-of-monitors into the data center to provide real-time visibility that survives when the primary monitoring systems fail.

Summary of the AWS Service Event in the Northern Virginia (US-EAST-1) Region, This congestion immediately impacted the availability of real-time monitoring data for our internal operations teams, which impaired their ability to find the source of congestion and resolve it. December 10th, 2021

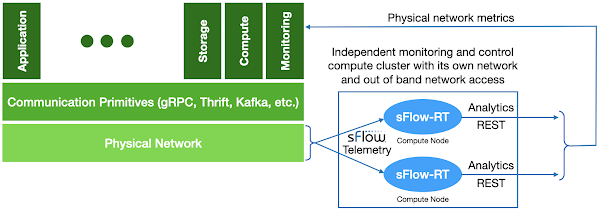
Standardizing on a small set of communication primitives (gRPC, Thrift, Kafka, etc.) simplifies the creation of large scale distributed services. The communication primitives abstract the physical network to provide reliable communication to support distributed services running on compute nodes. Monitoring is typically regarded as a distributed service that is part of the compute infrastructure, relying on agents on compute nodes to transmit measurements to scale out analysis, storage, automation, and presentation services.

System wide failures occur when the network abstraction fails and the limitations of the physical network infrastructure intrude into the overlaid monitoring, compute, storage, and application services. Physical network service failure is the Achilles heel of distributed compute infrastructure since the physical network is the glue that ties the infrastructure together.

However, the physical network is also a solution to the monitoring problem, providing an independent uncorrelated point of observation that has visibility into all the physical network resources and the services that run over them.

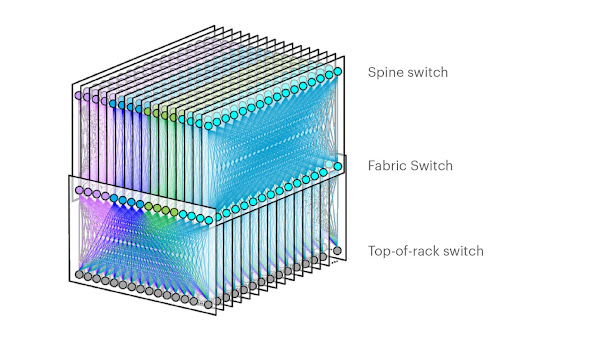
Reinventing Facebook’s data center network describes the architecture of a data center network. The network is a large distributed system made up of thousands of hardware switches and the tens of thousands of optical links that connect them. The network can route trillions of packets per second and has a capacity measured in Petabits/second.

The industry standard sFlow measurement system, implemented by all major data center network equipment vendors, is specifically designed to address the challenge of monitoring large scale switched networks. The sFlow specification embeds standard instrumentation into the hardware of each switch, making monitoring an integral part of the function of the switch, and ensuring that monitoring capacity scales out as network size increases.

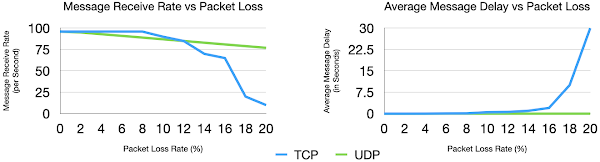
UDP vs TCP for real-time streaming telemetry describes how sFlow uses UDP to transport measurements from the network devices to the analytics software in order to maintain real-time visibility during network congestion events. The graphs from the article demonstrate that the different transport characteristics of UDP and TCP decouple the physical network monitoring system from the primary monitoring systems which typically depend on TCP services.

The diagram at the top of this article shows the elements of an sFlow monitoring system designed to provide independent visibility into large scale data center network infrastructure.

Each network device can be configured to send sFlow telemetry to at least two destinations. In the diagram two independent instances of the sFlow-RT real-time analytics engine are deployed on two separate compute nodes, each receiving its own stream of telemetry from all devices in the network. Since both sFlow-RT instances receive the same telemetry stream, they independently maintain copies of the network state that can be separately queried, ensuring availability in the event of a node failure.

Note: Tollerance to packet loss allows sFlow to be sent inband to reduce load on out-of-band management networks without significant loss of visibility. 

Scalability is ensured by sFlow's scale out hardware-based instrumentation. Leveraging the collective capability of the distributed instrumentation allows each sFlow-RT instance to monitor the current state of the entire data center network.

Tuning Performance describes how to optimize sFlow-RT performance for large scale monitoring.

The compute nodes hosting sFlow-RT instances should be physically separate from production compute service and have an independent network with out of band access so that measurements are available in cases were network performance issues have disrupted the production compute service.

This design is intentionally minimalist in order to reliably deliver real-time visibility during periods of extreme network congestion when all other systems fail.

In Failure Modes and Continuous Resilience, Adrian Cockroft states, The first technique is the most generally useful. Concentrate on rapid detection and response. In the end, when you’ve done everything you can do to manage failures you can think of, this is all you have left when that weird complex problem that no-one has ever seen before shows up!

With the state of the network stored in memory, each sFlow-RT instance provides an up to the second view of network performance with query response times measured in milliseconds. Queries are optimized to quickly diagnose network problems:

  • Detect network congestion
  • Identify traffic driving congestion
  • Locate control points to mitigate congestion
Real-time traffic analytics can drive automated remediation for common classes of problem to rapidly restore network service. Automated responses include:
  • Filtering out DDoS traffic
  • Shed non-essential services
  • Re-routing traffic
  • Shaping traffic
Of course, reliable control actions require an out-of-band management network so that controls can be deployed even if the production network is failing. Once physical network congestion problems have been addressed, restored monitoring services will provide visibility into production services and allow normal operations to resume. Real-time physical network visibility allows automated control actions to resolve physical network congestion problems within seconds so that there is negligible impact on the production systems.

Physical network visibility has utility beyond addressing extreme congestion events, feeding physical network flow analytics into production monitoring systems augments visibility and provides useful information for intrusion detection, capacity planning, workload placement, autoscaling, and service optimization. In addition, comparing the independently generated flow metrics profiling production services with the metrics generated by the production monitoring systems provides an early warning of  monitoring system reliability. Finally, the low latency of network flow metrics are a leading indicator of performance that can be used to improve the agility of production monitoring and control.

Getting started with sFlow is easy. Ideally, enable sFlow monitoring on the switches in a pod and install an instance of sFlow-RT to see traffic in your own environment, alternatively, Real-time telemetry from a 5 stage Clos fabric describes a lightweight emulation of realistic data center switch topologies using Docker and Containerlab that allows you to experiment with real-time sFlow telemetry and analytics before deploying into production.

Tuesday, August 31, 2021

Netdev 0x15


The recent Netdev 0x15 conference included a number of papers diving into the technology behind Linux as a network operating system. Slides and videos are now available on the conference web site.
Network wide visibility with Linux networking and sFlow describes the Linux switchdev driver used to integrate network hardware with Linux. The talk focuses on network telemetry, showing how standard Linux APIs are used to configure hardware instrumentation and stream telemetry using the industry standard sFlow protocol for data center wide visibility.
Switchdev in the wild describes Yandex's experience of deploying Linux switchdev based switches in production at scale. The diagram from the talk shows the three layer leaf and spine network architecture used in their data centers. Yandex operates multiple data centers, each containing up to 100,000 servers.
Switchdev Offload Workshop provides updates about the latest developments in the switchdev community. 
FRR Workshop discusses the latest development in the FRRouting project, the open source routing software that is now a defacto standard on Linux network operating systems.

Wednesday, August 18, 2021

Nokia Service Router Linux


Nokia Service Router Linux (SR-Linux) is an open source network operating system running on Nokia's merchant silicon based data center switches.

The following commands configure SR-Linux to sample packets at 1-in-10000, poll counters every 20 seconds and stream standard sFlow telemetry to an analyzer (192.168.10.20) using the default sFlow port 6343:

system {
    sflow {
        admin-state enable
        sample-rate 10000
        collector 1 {
            collector-address 192.168.10.20
            network-instance default
            source-address 192.168.1.1
            port 6343
        }
    }
}

For each interface:

interface ethernet-1/1 {
    admin-state enable
    sflow {
        admin-state enable
    }
}

Enable sFlow on all switches and ports in the data center fabric for comprehensive visibility.

An instance of the sFlow-RT real-time analytics software converts the raw sFlow telemetry into actionable measurements to drive operational dashboards and automation (e.g. DDoS mitigation, traffic engineering, etc.).
docker run --name sflow-rt -p 8008:8008 -p 6343:6343/udp -d sflow/prometheus
A simple way to get started is to run the Docker sflow/prometheus image on the sFlow analyzer host (192.168.10.20 in the example config) to run sFlow-RT with useful applications to explore the telemetry. Access the web interface at http://192.168.10.20:8008.

Tuesday, May 5, 2020

NVIDIA, Mellanox, and Cumulus

Recent press releases, Riding a Cloud: NVIDIA Acquires Network-Software Trailblazer Cumulus and NVIDIA Completes Acquisition of Mellanox, Creating Major Force Driving Next-Gen Data Centers, describe NVIDIA's moves to provide high speed data center networks to connect compute clusters that use of their GPUs to accelerate big data workloads, including: deep learning, climate modeling, animation, data visualization, physics, molecular dynamics etc.

Real-time visibility into compute, network, and GPU infrastructure is required manage and optimize the unified infrastructure. This article explores how the industry standard sFlow technology supported by all three vendors can deliver comprehensive visibility.

Cumulus Linux simplifies operations, providing the same operating system, Linux, that runs on the servers. Cumulus Networks and Mellanox have a long history of working with the Linux community to integrate support for switches. The latest Linux kernels now include native support for network ASICs, seamlessly integrating with standard Linux routing (FRR, Quagga, Bird, etc), configuration (Puppet, Chef, Ansible, etc) and monitoring (collectd, netstat, top, etc) tools.

Linux 4.11 kernel extends packet sampling support describes enhancements to the Linux kernel to support industry standard sFlow instrumentation in network ASICs. Cumulus Linux and Mellanox both support the new Linux APIs. Cumulus Linux uses the open source Host sFlow agent to stream telemetry gathered from the hardware, Linux operating system, and applications to a remote collector.

Ubuntu 18.04 and CentOS 8 describe how to install the Host sFlow agent on popular host Linux distributions. The Host sFlow agent is also available as a Docker image for easy deployment with container orchestration systems, see Host, Docker, Swarm and Kubernetes monitoring. Extending network visibility to the host allows network traffic to be associated with applications running on the host as well as providing details about the resources consumed by the applications and the network quality of service being delivered to the applications.

The Host sFlow agent also supports the sFlow NVML GPU Structures extension to export key metrics from NVIDIA GPUs using the NVIDIA Management Library (NVML), see GPU performance monitoring.

Enabling sFlow across the network, compute, and GPU stack provides a real-time, data center wide, view of performance. The sFlow-RT real-time analytics engine offers a convenient method of integrating sFlow analytics with popular orchestration, DevOps and SDN tools, examples include: Cumulus Networks, sFlow and data center automationFlow metrics with Prometheus and GrafanaECMP visibility with Cumulus LinuxFabric View, and Troubleshooting connectivity problems in leaf and spine fabrics.

Wednesday, October 30, 2019

Observability in Data Center Networks


Observability in Data Center Networks: In this session, you’ll learn how the sFlow protocol provides broad visibility in modern data center environments as they migrate to highly meshed topologies. Our data center workloads are shifting to take advantage of higher speeds and bandwidth, so visibility to east-west traffic within the data center is becoming more important. Join Peter Phaal—one of the inventors of sFlow—and Joe Reves from SolarWinds product management as they discuss how sFlow differs from other flow instrumentation to deliver visibility in the switching fabric.
THWACKcamp is SolarWinds’ free, annual, worldwide virtual IT learning event connecting thousands of skilled IT professionals with industry experts and SolarWinds technical staff. This video was one of the sessions.

Thursday, November 15, 2018

Mininet, ONOS, and segment routing

Leaf and spine traffic engineering using segment routing and SDN and CORD: Open-source spine-leaf Fabric describe a demonstration at the 2015 Open Networking Summit using the ONOS SDN controller and a physical network of 8 switches.

This article will describe how to emulate a leaf and spine network using Mininet and configure the ONOS segment routing application to provide equal cost multi-path (ECMP) routing of flows across the fabric. The Mininet Dashboard application running on the sFlow-RT real-time analytics platform is used to provide visibility into traffic flows across the emulated network.

First, run ONOS using Docker:
docker run --name onos --rm -p 6653:6653 -p 8181:8181 -d onosproject/onos
Use the graphical interface, http://onos:8181, to enable the OpenFlow Provider Suite, Network Config Host Provider, Network Config Link Provider, and Segment Routing applications. The screen shot above shows the resulting set of enabled services.

Next, install sFlow-RT and the Mininet Dashboard application on host with Mininet:
wget https://inmon.com/products/sFlow-RT/sflow-rt.tar.gz
tar -xvzf sflow-rt.tar.gz
./sflow-rt/get-app.sh sflow-rt mininet-dashboard
Start sFlow-RT:
./sflow-rt/start.sh
Download the sr.py script:
wget https://raw.githubusercontent.com/sflow-rt/onos-sr/master/sr.py
Start Mininet:
sudo env ONOS=10.0.0.73 mn --custom sr.py,sflow-rt/extras/sflow.py \
--link tc,bw=10 --topo=sr '--controller=remote,ip=$ONOS,port=6653'
The sr.py script is used to create a leaf and spine topology in Mininet and send the network configuration to the ONOS controller. The sflow.py script enables sFlow monitoring of the switches and sends the network topology to sFlow-RT.

The leaf and spine topology will appear in the ONOS web interface.
The topology will also appear in the Mininet Dashboard application:
Run an iperf test using the Mininet cli:
mininet> iperf h1 h3
The path that the traffic takes is highlighted on the Mininet Dashboard topology:
In this case the traffic flowed between leaf1 and leaf2 via spine1. Since ONOS segment routing uses equal cost multi-path routing, subsequent iperf tests may take the alternative via spine2.
Switch to the Charts tab to see traffic trend charts. In this case, the trend charts show the results of six iperf tests. The Traffic chart shows the top flows and the Topology charts show the busy links and the network diameter.

See Writing Applications for an introduction to programming sFlow-RT's analytics engine. Mininet flow analytics provides a simple example of detecting large (elephant) flows.

Thursday, July 19, 2018

ExtremeXOS 22.5.1 adds support Broadcom ASIC table utilization statistics

ExtremeXOS 22.5.1 is now available! describes added support in sFlow for "New data structures to support reporting on hardware/table utilization statistics." The feature is available on Summit X450-G2, X460-G2, X670-G2, X770, and ExtremeSwitching X440-G2, X870, X620, X690 series switches.

Figure 1 shows the packet processing pipeline of a Broadcom ASIC. The pipeline consists of a number of linked hardware tables providing bridging, routing, access control list (ACL), and ECMP forwarding group functions. Operations teams need to be able to proactively monitor table utilizations in order to avoid performance problems associated with table exhaustion.

Broadcom's sFlow specification, sFlow Broadcom Switch ASIC Table Utilization Structures, leverages the industry standard sFlow protocol to offer scaleable, multi-vendor, network wide visibility into the utilization of these hardware tables.

The following output from the open source sflowtool command line utility shows the raw table measurements (this is in addition to the extensive set of measurements already exported via sFlow by ExtremeXOS):
bcm_asic_host_entries 4
bcm_host_entries_max 8192
bcm_ipv4_entries 0
bcm_ipv4_entries_max 0
bcm_ipv6_entries 0
bcm_ipv6_entries_max 0
bcm_ipv4_ipv6_entries 9
bcm_ipv4_ipv6_entries_max 16284
bcm_long_ipv6_entries 3
bcm_long_ipv6_entries_max 256
bcm_total_routes 10
bcm_total_routes_max 32768
bcm_ecmp_nexthops 0
bcm_ecmp_nexthops_max 2016
bcm_mac_entries 3
bcm_mac_entries_max 32768
bcm_ipv4_neighbors 4
bcm_ipv6_neighbors 0
bcm_ipv4_routes 0
bcm_ipv6_routes 0
bcm_acl_ingress_entries 842
bcm_acl_ingress_entries_max 4096
bcm_acl_ingress_counters 68
bcm_acl_ingress_counters_max 4096
bcm_acl_ingress_meters 18
bcm_acl_ingress_meters_max 8192
bcm_acl_ingress_slices 3
bcm_acl_ingress_slices_max 8
bcm_acl_egress_entries 36
bcm_acl_egress_entries_max 512
bcm_acl_egress_counters 36
bcm_acl_egress_counters_max 1024
bcm_acl_egress_meters 18
bcm_acl_egress_meters_max 512
bcm_acl_egress_slices 2
bcm_acl_egress_slices_max 2
The sflowtool output is useful for troubleshooting and is easy to parse with scripts.

A convenient way to run sflowtool is to use Docker:
docker run -p 6343:6343/udp sflow/sflowtool

Ethernet Fabric Visibility

Ethernet Fabrics: Extreme Networks ExtremeFabric
Leaf and spine fabrics are challenging to monitor. The fabric spreads traffic across all the switches and links in order to maximize bandwidth. Unlike traditional hierarchical network designs, where a small number of links can be monitored to provide visibility, a leaf and spine network has no special links or switches where running CLI commands or attaching a probe would provide visibility. Even if it were possible to attach probes, the effective bandwidth of a leaf and spine network can be as high as a Petabit/second, well beyond the capabilities of current generation monitoring tools.

Fabric View solves the visibility challenge by using the industry standard sFlow instrumentation built into data center switches. Fabric View represents the fabric as if it were a single large chassis switch, treating each leaf switch as a line card and the spine switches as the backplane. The result is an intuitive tool that is easily understood by anyone familiar with traditional networks.

A demonstration can be run using Docker:
docker run --entrypoint /sflow-rt/run_demo.sh -p 8008:8008 sflow/fabric-view
Access the web interface on port 8008.
The first chart shows the largest TCP/UDP flows traversing the fabric (calculated from a continues stream of packet samples received from all the switches in the fabric). The chart updates every second, providing a real-time view of traffic crossing the fabric.
The last two charts are based on the hardware/table utilization statistics that are now implemented in ExtremeXOS, trending the maximum utilization of each table across all the switches in the fabric.

sFlow-RT

FabricView is one of a number of applications developed for sFlow-RT. Examples include: DDoS mitigation, Internet routing using top of rack switches, and other articles on this blog.
The sFlow-RT analytics engine receives a continuous telemetry stream from sFlow Agents embedded in network devices, hosts and applications and converts them into actionable metrics, accessible through APIs. Applications can be external, written in any language that supports HTTP/REST calls, or internal, using sFlow-RT's embedded JavaScript/ECMAScript.

Saturday, September 17, 2016

Triggered remote packet capture using filtered ERSPAN

Packet brokers are typically deployed as a dedicated network connecting network taps and SPAN/mirror ports to packet analysis applications such as Wireshark, Snort, etc.

Traditional hierarchical network designs were relatively straightforward to monitor using a packet broker since traffic flowed through a small number of core switches and so a small number of taps provided network wide visibility. The move to leaf and spine fabric architectures eliminates the performance bottleneck of core switches to deliver low latency and high bandwidth connectivity to data center applications. However, traditional packet brokers are less attractive since spreading traffic across many links with equal cost multi-path (ECMP) routing means that many more links need to be monitored.

This article will explore how the remote Selective Spanning capability in Cumulus Linux 3.0 combined with industry standard sFlow telemetry embedded in commodity switch hardware provides a cost effective alternative to traditional packet brokers.

Cumulus Linux uses iptables rules to specify packet capture sessions. For example, the following rule forwards packets with source IP 20.0.1.0 and destination IP 20.0.1.2 to a packet analyzer on host 20.0.2.2:
-A FORWARD --in-interface swp+ -s 20.0.0.2 -d 20.0.1.2 -j ERSPAN --src-ip 90.0.0.1 --dst-ip 20.0.2.2
REST API for Cumulus Linux ACLs describes a simple Python wrapper that exposes IP tables through a RESTful API. For example, the following command remotely installs the capture rule on switch 10.0.0.233:
curl -H "Content-Type:application/json" -X PUT --data \
  '["[iptables]","-A FORWARD --in-interface swp+ -s 20.0.0.2 -d 20.0.1.2 -j ERSPAN --src-ip 90.0.0.1 --dst-ip 20.0.2.2"]' \
  http://10.0.0.233:8080/acl/capture1
The following command deletes the rule:
curl -X DELETE http://10.0.0.233:8080/acl/capture1
Selective Spanning makes it possible to turn every switch and port in the network into a capture device. However, it is import to carefully select which traffic to capture since the aggregate bandwidth of an ECMP fabric is measured in Terabits per second - far more traffic than can be handled by typical packet analyzers.
SDN packet broker describes an analogy for the role that sFlow plays in steering the capture network to that of a finderscope, the small wide-angle telescope used to provide an overview of the sky and guide a telescope to its target. The article goes on to describes some of the benefits of combining sFlow analytics with selective packet capture:
  1. Offload The capture network is a limited resource, both in terms of bandwidth and in the number of flows that can be simultaneously captured.  Offloading as many tasks as possible to the sFlow analyzer frees up resources in the capture network, allowing the resources to be applied where they add most value. A good sFlow analyzer delivers data center wide visibility that can address many traffic accounting, capacity planning and traffic engineering use cases. In addition, many of the packet analysis tools (such as Wireshark) can accept sFlow data directly, further reducing the cases where a full capture is required.
  2. Context Data center wide monitoring using sFlow provides context for triggering packet capture. For example, sFlow monitoring might show an unusual packet size distribution for traffic to a particular service. Queries to the sFlow analyzer can identify the set of switches and ports involved in providing the service and identify a set of attributes that can be used to selectively capture the traffic.
  3. DDoS Certain classes of event such as DDoS flood attacks may be too large for the capture network to handle. DDoS mitigation with Cumulus Linux frees the capture network to focus on identifying more serious application layer attacks.
The diagram at the top of this article shows an example of using sFlow to target selective capture of traffic to blacklisted addresses. In this example sFlow-RT is used to perform real-time sFlow analytics. The following emerging.js script instructs sFlow-RT to download the Emerging Threats blacklist and identify any local hosts that are communicating with addresses in the blacklist. A full packet capture is triggered when a potentially compromised host is detected:
var wireshark = '10.0.0.70';
var idx=0;
function capture(localIP,remoteIP,agent) {
  var acl = [
    '[iptables]',
    '# emerging threat capture',
    '-A FORWARD --in-interface swp+ -s '+localIP+' -d '+remoteIP 
    +' -j ERSPAN --src-ip '+agent+' --dst-ip '+wireshark,
    '-A FORWARD --in-interface swp+ -s '+remoteIP+' -d '+localIP 
    +' -j ERSPAN --src-ip '+agent+' --dst-ip '+wireshark
  ];
  var id = 'emrg'+idx++;
  logWarning('capturing '+localIP+' rule '+id+' on '+agent);
  http('http://'+agent+':8080/acl/'+id,
        'PUT','application/json',JSON.stringify(acl));
}

var groups = {};
function loadGroup(name,url) {
  try {
    var res, cidrs = [], str = http(url);
    var reg = /^(\d{1,3}\.){3}\d{1,3}(\/\d{1,2})?$/mg;
    while((res = reg.exec(str)) != null) cidrs.push(res[0]);
    if(cidrs.length > 0) groups[name]=cidrs;
  } catch(e) {
    logWarning("failed to load " + url + ", " + e);
  }
}

loadGroup('compromised',
  'https://rules.emergingthreats.net/blockrules/compromised-ips.txt');
loadGroup('block',
  'https://rules.emergingthreats.net/fwrules/emerging-Block-IPs.txt');
setGroups('emerging',groups);

setFlow('emerging',
  {keys:'ipsource,ipdestination,group:ipdestination:emerging',value:'frames',
   log:true,flowStart:true});

setFlowHandler(function(rec) {
  var [localIP,remoteIP,group] = rec.flowKeys.split(',');
  try { capture(localIP,remoteIP,rec.agent); }
  catch(e) { logWarning("failed to capture " + e); }
});
Some comments about the script:
  1. The script uses sFlow telemetry to identify the potentially compromised host and the location (agent) observing the traffic.
  2. The location information is required so that the capture rule can be installed on a switch that is in the traffic path.
  3. The application has been simplified for clarity. In production, the blacklist information would be periodically updated and the capture sessions would be tracked so that they can be deleted when they they are no longer required.
  4. Writing Applications provides an introduction to sFlow-RT's API.
Configure sFlow on the Cumulus switches to stream telemetry to a host running Docker. Next, log into the host and run the following command in a directory containing the emerging.js script:
docker run -v "$PWD/emerging.js":/sflow-rt/emerging.js \
 -e "RTPROP=-Dscript.file=emerging.js" -p 6343:6343/udp sflow/sflow-rt
Note: Deploying analytics as a Docker service is a convenient method of packaging and running sFlow-RT. However, you can also download and install sFlow-RT as a package.

Once the software is running, you should see output similar to the following:
2016-09-17T22:19:16+0000 INFO: Listening, sFlow port 6343
2016-09-17T22:19:16+0000 INFO: Listening, HTTP port 8008
2016-09-17T22:19:16+0000 INFO: emerging.js started
2016-09-17T22:19:44+0000 WARNING: capturing 10.0.0.162 rule emrg0 on 10.0.0.253
The last line shows that traffic from host 10.0.0.162 to a blacklisted address has been detected and that selective spanning session has been configured on switch 10.0.0.253 to capture packets and send them to the host running Wireshark (10.0.0.70) for further analysis.

Thursday, June 16, 2016

Cisco Tetration analytics

Cisco Tetration Analytics: the most Comprehensive Data Center Visibility and Analysis in Real Time, at Scale, June 15, 2016, announced the new Cisco Tetration Analytics platform. The platform collects telemetry from proprietary agents on servers and embedded in hardware on certain Nexus 9k switches, analyzes the data, and presents results via Web GUI, REST API, and as events.

Cisco Tetration Analytics Data Sheet describes the hardware requirements:
Platform Hardware
Quantity
Cisco Tetration Analytics computing nodes (servers)
16
Cisco Tetration Analytics base nodes (servers)
12
Cisco Tetration Analytics serving nodes (servers)
8
Cisco Nexus 9372PX Switches
3

And the power requirements:
Property
Cisco Tetration Analytics Platform
Peak power for Cisco Tetration Analytics Platform (39-RU single-rack option)
22.5 kW
Peak power for Cisco Tetration Analytics Platform (39-RU dual-rack option)
11.25 kW per rack (22.5 KW Total)

No pricing is given, but based on the hardware, data center space, power and cooling requirements, this brute force approach to analytics will be reassuringly expensive to purchase and operate.

Update June 22, 2016: See 451 Research report, Cisco Tetration: a $3m, 1,700-pound appliance for network traffic analytics is born, for pricing information.
A much less expensive alternative is to use industry standard sFlow agents embedded in Cisco Nexus 9k/3k switches and in switches from over 40 other vendors. The open source Host sFlow agent extends visibility to servers and applications by streaming telemetry from Linux, Windows, FreeBSD, Solaris, and AIX operating system, hypervisors, Docker containers, web servers (Apache, NGINX, Tomcat, HAproxy) and Java application servers.

The diagram shows how the sFlow-RT real-time analytics engine receives a continuous telemetry stream from sFlow instrumentation build into network, server and application infrastructure and delivers analytics through APIs and can easily be integrated with a wide variety of on-site and cloud, orchestration, DevOps and Software Defined Networking (SDN) tools.

Minimizing cost of visibility describes why lightweight monitoring is critical to realizing the value that telemetry can bring to improving operational efficiency. In the case of the sFlow based solution, the critical data path instrumentation is built into the switch ASICs and in the Linux kernel, ensuring that there is negligible impact on operational performance.

The sFlow-RT analytics software shown in the diagram provides real-time (sub second) visibility for 5,000 unique end points (Virtual Machines or Bare metal server), the upper limit of scaleability in the Tetration data sheet, using a single virtual machine or Docker container with 4 GBytes of RAM and 4 CPU cores. With additional memory and CPU the solution easily scales to 100,000 unique end points.
How can sFlow provide real-time visibility at scale and consume so few resources? Shrink ray describes how advanced statistical techniques are used to select and analyze measurements that capture the essential features of network and system performance. A statistical approach yields fast, accurate answers, while minimizing the resources required to measure, transport and analyze the data.
The sFlow-RT analytics platform was selected as an example because of the overlap in capabilities with the Cisco Tetration analytics platform. However, sFlow is non-proprietary and there are many other open source and commercial sFlow analytics solutions listed on sFlow.org.

The Cisco press release states, "Available in July 2016, the first Tetration platform will be a full rack appliance that is deployed on-premise at the customer’s data center." On the other hand, the sFlow based solution described here is available today and can be installed and running in minutes on a virtual machine or in a Docker container.

Wednesday, June 15, 2016

Programmable hardware: Barefoot Networks, PISA, and P4

Barefoot Networks recently came out of stealth to reveal their  Tofino 6.5Tbit/second (65 X 100GE or 260 X 25GE) fully user-programmable switch. The diagram above, from the talk Programming The Network Data Plane by Changhoon Kim of Barefoot Networks, shows the Protocol Independent Switch Architecture (PISA) of the programmable switch silicon.
A logical switch data-plane described in the P4 language is compiled to program the general purpose PISA hardware. For example, the following P4 code snippet is part of a P4 sFlow implementation:
table sflow_ing_take_sample {
    /* take_sample > MAX_VAL_31 and valid sflow_session_id => take the sample */
    reads {
        ingress_metadata.sflow_take_sample : ternary;
        sflow_metadata.sflow_session_id : exact;
    }
    actions {
        nop;
        sflow_ing_pkt_to_cpu;
    }
}
Network visibility is one of the major use cases for P4 based switches. Improving Network Monitoring and Management with Programmable Data Planes describes how P4 can be used to collect information about latency and queueing in the switch forwarding pipeline.
The document also describes an architecture for In-band Network Telemetry (INT) in which the ingress switch is programmed to insert a header containing measurements to packets entering the network. Each switch in the path is programmed to append additional measurements to the packet header. The egress switch is programmed to remove the header so that the packet can be delivered to its destination. The egress switch is responsible for processing the measurements or sending them on to analytics software.

In-band telemetry is an interesting example of the flexibility provided by P4 programmable hardware and the detailed information that can be gathered about latency and queueing from the hardware forwarding pipeline. However, there are practical issues that should be considered with this approach:
  1. Transporting measurement headers is complex with different encapsulations for each transport protocol:  Geneve, VxLAN, etc.
  2. Addition of headers increases the size of packets and risks causing traffic to be dropped downstream due to maximum transmission unit (MTU) restrictions.
  3. The number of measurements that can be added by each switch and the number of switches adding measurements in the path needs to be limited.
  4. In-band telemetry cannot be incrementally deployed. Ideally, all devices need to participate, or at a minimum, the ingress and egress devices need to be in-band telemetry aware.
  5. In-band telemetry transports data from the data plane to the control/management planes, providing a potential attack surface that could be exploited by crafting malicious packets with fake measurement headers.
The sFlow architecture provides an out of band alternative for transporting the per packet forwarding plane measurements defined by INT. Instead of adding the measurements to the egress packet, measurements can be attached as metadata to the sampled packets that are handed to the switch CPU. The sFlow agent immediately forwards the additional packet metadata as part of the standard sFlow telemetry stream to a centralized collector. Using sFlow as the telemetry transport has a number of benefits:
  1. Simple to deploy since there is no modification of packets (no issues with encapsulations, MTU, number of measurements, path length, incremental deployment, etc.)
  2. Extensibility of sFlow protocol allows additional forwarding plane measurements to augment standard sFlow measurements, fully integrating the new measurements with sFlow data exported from other switches in the network (sFlow is supported by over 40 switch vendors and is a standard feature of switch ASICs).
  3. sFlow's is a unidirectional telemetry transport protocol originates from the device management plane, can be sent out of band, limiting possible attack surfaces.
The great thing about programmable hardware is that behavior can be modified by changing the software. Implementing out of band telemetry is a matter of combining measurements from the P4 INT code with the P4 sFlow agent code. Compiling and installing out of band sFlow telemetry code reprograms the hardware to implement the new scheme.

The advent of P4 and programmable hardware opens up exciting possibilities for defining additional packet sample metadata, counters, and gauges to augment the sFlow telemetry stream and gain additional insight into the performance of production traffic in large scale, high capacity, networks.

The real-time sFlow streaming telemetry can be used to drive automated controls, for example, to block DDoS attacks, or load balance large "Elephant" flows across multiple paths. Here again P4 combined with programmable hardware makes it possible to create additional control capabilities, for example, to be able to block the large numbers of source addresses involved in a DDoS attack, where sFlow analytics would be used to identify the attackers and their points of ingress and program each of the switches with filters based on their location in the network. The ability to customize the hardware to address specific tasks makes more efficient use of hardware resources than is possible with fixed function device. In this case, defining a specialized DDoS drop table would allow for a much larger number of filters than would be possible with a general purpose ACL table.

Tuesday, June 14, 2016

Merchant silicon based routing, flow analytics, and telemetry

Drivers for growth describes how switches built on merchant silicon from Broadcom ASICs dominate the current generation of data center switches, reduce hardware costs, and support an open ecosystem of switch operating systems (Cumulus Linux, OpenSwitch, Dell OS10, Broadcom FASTPATH, Pica8 PicOS, Open Network Linux, etc.).

The router market is poised to be similarly disrupted with the introduction of devices based on Broadcom's Jericho ASIC, which has the capacity to handle over 1 million routes in hardware (the full Internet routing table is currently around 600,000 routes).
An edge router is a very pricey box indeed, often costing anywhere from $100,000 to $200,000 per 100 Gb/sec port, depending on features in the router and not including optical cables that are also terribly expensive. Moreover, these routers might only be able to cram 80 ports into a half rack or full rack of space. The 7500R universal spine and 7280R universal leaf switches cost on the order of $3,000 per 100 Gb/sec port, and they are considerably denser and less expensive. - Leaving Fixed Function Switches Behind For Universal Leafs
Broadcom Jericho ASICs are currently available in Arista 7500R/7280R routers and in Cisco NCS 5000 series routers. Expect further disruption to the router market when white box versions of the 1U router hardware enter the market.
There was general enthusiasm for Broadcom Jericho based routers in a recent discussion on the North American Network Operators' Group (NANOG) mailing list, Arista Routing Solutions, so merchant silicon based routers should be expected to sell well.
The Broadcom Jericho ASICs also include hardware instrumentation to support industry standard sFlow traffic monitoring and streaming telemetry. For example, the following commands enable sFlow on all ports on an Arista router:
sflow source-interface Management1
sflow destination 170.1.1.11
sflow polling-interval 30
sflow sample 65535
sflow run
See EOS System Configuration Guide for details.

While Cisco supports standard sFlow on merchant silicon based switch platforms, see Cisco adds sFlow support, Cisco adds sFlow support to Nexus 9K series, and Cisco SF250, SG250, SF350, SG350, SG350XG, and SG550XG series switches. Unfortunately, IOS XR on Cisco's Jericho based routers doesn't yet support sFlow. Instead, a complex set of commands is required to configure Cisco's proprietary NetFlow and streaming telemetry protocols:
RP/0/RP0/CPU0:router#config
RP/0/RP0/CPU0:router(config)#flow exporter-map exp1
RP/0/RP0/CPU0:router(config-fem)#version v9
RP/0/RP0/CPU0:router(config-fem-ver)#options interface-table timeout 300
RP/0/RP0/CPU0:router(config-fem-ver)#options sampler-table timeout 300
RP/0/RP0/CPU0:router(config-fem-ver)#template data timeout 300
RP/0/RP0/CPU0:router(config-fem-ver)#template options timeout 300
RP/0/RP0/CPU0:router(config-fem-ver)#exit 
RP/0/RP0/CPU0:router(config-fem)#transport udp 12515
RP/0/RP0/CPU0:router(config-fem)#source Loopback0
RP/0/RP0/CPU0:router(config-fem)#destination 170.1.1.11
RP/0/RP0/CPU0:router(config-fmm)#exit
RP/0/RP0/CPU0:router(config)#flow monitor-map MPLS-IPv6-fmm
RP/0/RP0/CPU0:router(config-fmm)#record mpls ipv6-fields labels 3
RP/0/RP0/CPU0:router(config-fmm)#exporter exp1
RP/0/RP0/CPU0:router(config-fmm)#cache entries 10000
RP/0/RP0/CPU0:router(config-fmm)#cache permanent
RP/0/RP0/CPU0:router(config-fmm)#exit
RP/0/RP0/CPU0:router(config)#sampler-map FSM
RP/0/RP0/CPU0:router(config-sm)#random 1 out-of 65535
RP/0/RP0/CPU0:router(config-sm)# exit
And further commands are needed to enable monitoring on each interface (and there can be a large number of interfaces given the high port density of these routers):
RP/0/RP0/CPU0:router(config)#interface HundredGigE 0/3/0/0
RP/0/RP0/CPU0:router(config-if)#flow mpls monitor MPLS-IPv6-fmm sampler FSM ingress
See Netflow Configuration Guide for Cisco NCS 5500 Series Routers, IOS XR Release 6.0.x for configuration details and limitations.

We are still not done, further steps are required to enable the equivalent to sFlow's streaming telemetry.

Create policy file defining the counters to export:
{
 "Name": "Test",
 "Metadata": {
  "Version": 25,
  "Description": "This is a sample policy",
  "Comment": "This is the first draft",
  "Identifier": "data that may be sent by the encoder to the mgmt stn"
 },
 "CollectionGroups": {
  "FirstGroup": {
  "Period": 30,
  "Paths": [
   "RootOper.InfraStatistics.Interface(*).Latest.GenericCounters"
   ]
  }
 }
}
Copy the policy file to router:
$ scp Test.policy cisco@170.1.1.1:/telemetry/policies
Finally, configure the JSON encoder:
Router# configure
Router(config)#telemetry encoder json
Router(config-telemetry-json)#policy group FirstGroup
Router(config-policy-group)#policy Test
Router(config-policy-group)#destination ipv4 170.1.1.11 port 5555
Router(config-policy-group)#commit
See Cisco IOS XR Telemetry Configuration Guide for details.
Software defined analytics describes how the sFlow architecture disaggregates the flow analytics pipeline and integrates telemetry export to reduce complexity and increase flexibility. The reduced configuration complexity is clearly illustrated by the two configuration examples above.

Unlike the complex and disparate monitoring mechanisms in IOS XR, sFlow offers a simple, flexible and unified monitoring solution that exposes the full monitoring capabilities of the Broadcom Jericho ASIC. Expect a future release of IOS XR to add the sFlow support since sFlow a natural fit for the hardware capabilities of Jericho based router platforms and the addition of sFlow support will provide feature parity with Cisco's merchant silicon based switches.

Finally, the real-time visibility provided by sFlow supports a number of important use cases for high performance routers, including:
  • DDoS mitigation
  • Load balancing ECMP paths
  • BGP route analytics
  • Traffic engineering
  • Usage based accounting
  • Enforcing usage quotas