Showing posts with label Raspberry Pi. Show all posts

Monday, January 15, 2024

Raspberry Pi 5 network emulation with Containerlab

The GitHub sflow-rt/containerlab project contains example network topologies for the Containerlab network emulation tool that demonstrate real-time streaming telemetry in realistic data center topologies and network configurations. The examples use the same FRRouting (FRR) engine that is part of SONiC, NVIDIA Cumulus Linux, and DENT network operating systems. Containerlab can be used to experiment before deploying solutions into production. Examples include: tracing ECMP flows in leaf and spine topologies, EVPN visibility, and automated DDoS mitigation using BGP Flowspec and RTBH controls.
Raspberry Pi 5 real-time network analytics describes how to install Docker on a Raspberry Pi 5.
docker run hello-world
Run the hello-world container to verify that Docker in properly installed and running before proceeding.
git clone https://github.com/sflow-rt/containerlab.git
Download the sflow-rt/containerlab project from GitHub.
cd containerlab
./run-clab
Start Containerlab.
containerlab deploy -t clos5.yml
Start the 5 stage leaf and spine topology shown at the top of this page. The initial launch may take a couple of minutes as the container images are downloaded for the first time. Once the images are downloaded, the topology deploys in around 10 seconds.
./topo.py clab-clos5
Push the topology to the sFlow-RT analytics software.
An instance of the sFlow-RT real-time analytics engine receives industry standard sFlow telemetry from all the switches in the network. All of the switches in the topology are configured to send sFlow to the sFlow-RT instance. In this case, Containerlab is running the pre-built sflow/clab-sflow-rt image which packages sFlow-RT with useful applications for exploring the data.
Connect to the web interface on port 8008. The sFlow-RT dashboard verifies that telemetry is being received from 10 agents (the 10 switches in the Clos fabric). See the sFlow-RT Quickstart guide for more information.
The Containerlab Dashboard (click on sFlow-RT Apps tab and containerlab-dashboard button) shows real-time dashboard displaying up to the second traffic.
docker exec -it clab-clos5-h1 iperf3 -c 172.16.4.2
Each of the hosts in the network has an iperf3 server, so running the above command will test bandwidth between h1 and h4.
docker exec -it clab-clos5-h1 iperf3 -c 2001:172:16:4::2
Generate a large IPv6 flow between h1 and h4. The traffic flows should immediately appear in the Top Flows chart. You can check the accuracy by comparing the values reported by iperf3 with those shown in the chart.
Click on the Topology tab to see a real-time weathermap of traffic flowing over the topology. See how repeated iperf3 tests take different ECMP (equal-cost multi-path) routes across the network.
docker exec -it clab-clos5-leaf1 vtysh
Linux with open source routing software (FRRouting) is an accessible alternative to vendor routing stacks (no registration / license required, no restriction on copying means you can share images on Docker Hub, no need for virtual machines). FRRouting is popular in production network operating systems (e.g. Cumulus Linux, SONiC, DENT, etc.) and the VTY shell provides an industry standard CLI for configuration, so labs built around FRR allow realistic network configurations to be explored.
docker exec -it clab-clos5-leaf1 vtysh -c "show running-config"
Use vtysh to show the running configuration on leaf1.
containerlab destroy -t clos5.yml
When you are finished, run the above command to stop the containers and free the resources associated with the emulation. Try out other topologies from the project to explore topics such as DDoS mitigation, BGP Flowspec, and EVPN.

Note: If you are building your own topologies, the Raspberry Pi 5 8G can comfortably handle topologies with up to 50 FRR/Alpine Linux nodes.

Getting Started provides an introduction to sFlow-RT analytics and APIs. Containerlab provides a useful environment for developing and testing monitoring applications for sFlow-RT before moving them into production.

Moving monitoring solutions from Containerlab to production is straightforward since sFlow is widely implemented in datacenter equipment from vendors including: A10, Arista, Aruba, Cisco, Edge-Core, Extreme, Huawei, Juniper, NEC, Netgear, Nokia, NVIDIA, Quanta, and ZTE. In addition, the open source Host sFlow agent makes it easy to extend visibility beyond the physical network into the compute infrastructure.

Raspberry Pi 5 real-time network analytics describes how to deploy an sFlow-RT, Prometheus, and Grafana monitoring stack to monitor live network traffic.

Tuesday, January 9, 2024

Raspberry Pi 5 real-time network analytics

CanaKit Raspberry Pi 5 Starter Kit - Aluminum
This article describes how build an inexpensive Raspberry Pi 5 based server for real-time flow analytics using industry standard sFlow streaming telemetry. Support for sFlow is widely implemented in datacenter equipment from vendors including: A10, Arista, Aruba, Cisco, Edge-Core, Extreme, Huawei, Juniper, NEC, Netgear, Nokia, NVIDIA, Quanta, and ZTE.
In this example, we will use an 8G Raspberry Pi 5 running Raspberry Pi OS Lite (64-bit).  The easiest way to format a memory card and install the operating system is to use the Raspberry Pi Imager (shown above).
Click on EDIT SETTINGS button to customize the installation.
Set a hostname, username, and password.
Click on the SERVICES tab and select Enable SSH.  Click SAVE to save the settings and then YES to apply the settings and create a bootable micro SD card. These initial settings allow the Rasberry Pi to be accessed over the network without having to attach a screen, keyboard, and mouse.
ssh pp@192.168.4.170
Use ssh to log into Raspberry Pi (having installled the micro SD card).
sudo apt-get update && sudo apt-get -y upgrade
Update packages and OS to latest version.
curl -sSL https://get.docker.com | sh
Install Docker.
sudo usermod -aG docker $USER
Give permission to run Docker without sudo command. Exit ssh session and log in again to pick up the new settings.
docker run hello-world
Run the hello-world container to verify that docker in properly installed and running.
git clone https://github.com/sflow-rt/prometheus-grafana.git
cd prometheus-grafana
./start.sh
Start sFlow-RT, Prometheus, and Grafana using Docker compose.
Configure sFlow Agents embedded in switches, routers and servers to stream sFlow telemetry to the Raspberry Pi. The sFlow-RT Getting Started guide shows how to verify that sFlow is being received and includes tools flow and counter based analytics.
For example, the Flow Browser application lets you list attributes of network traffic that you are interested in and trend top flows with the attributes in real-time (up to the second). Defining Flows describes the flow analytics capability of sFlow-RT that can be explored.
Deploy real-time network dashboards using Docker compose describes how to configure Prometheus and Grafana to capture time series data and create custom dashboards.
The Raspberry Pi 5 is surprisingly capable, this pocket-sized server can easily monitor thousands of high speed (100G+) links, providing up to the second visibility into network flows. In this example, sFlow telemetry from 100 switches, each with 48 active 100G ports, was easily handled by the Raspberry Pi 5. Performance of the Prometheus database is likely to be the limiting factor given the relatively slow disk performance of the micro SD card, but could be improved adding an M.2 PCIe disk.

Thursday, July 13, 2023

Deploy real-time network dashboards using Docker compose


This article demonstrates how to use docker compose to quickly deploy a real-time network analytics stack that includes the sFlow-RT analytics engine, Prometheus time series database, and Grafana to create dashboards.
git clone https://github.com/sflow-rt/prometheus-grafana.git
cd prometheus-grafana
./start.sh
Download the sflow-rt/prometheus-grafana project from GitHub on a system with Docker installed and start the containers. The start.sh script runs docker compose to bring up the containers specified in the compose.yml file, passing in user information so that the containers have correct permission to  write data files in the prometheus and grafana directories.
All the Docker images in this example are available for both x86 and ARM processors, so this stack can be deployed on Intel/AMD platforms as well as Apple M1/M2 or Raspberry Pi. Raspberry Pi 4 real-time network analytics describes how to configure a Raspberry Pi 4 to run Docker and perform real-time network analytics and is a simple way to run this stack for smaller networks.

Configure sFlow Agents in network devices to stream sFlow telemetry to the host running the analytics stack. See Getting Started for information on how to verify that sFlow telemetry is being received.

Connect to the Grafana web interface on port 3000 using default user name and password (admin/admin). You will be promted to change the password.
Select the option to Import a new Dashboard.
Enter the code 11201 to import sFlow-RT Network Interfaces dashboard from Grafana.com and click on the Load button.
Select the sflow_rt_data Prometheus database and click on the Import button.
The dashboard should appear showing top interfaces by Utilization, Discards and Errors.
Repeat the steps to add the sFlow-RT Health dashboard, code 11096.

The sFlow-RT Countries and Networks dashboard is an example of a flow based metric, plotting information about source and destination countries and provider networks based on traffic analytics.

Prometheus has already been programmed to gather metrics for the previous two example, but to run this third example, we need to modify the Prometheus configuration to gather the flow based metrics needed for the dashboard.

  - job_name: 'sflow-rt-countries'
    metrics_path: /app/prometheus/scripts/export.js/flows/ALL/txt
    static_configs:
      - targets: ['sflow-rt:8008']
    params:
      metric: ['sflow_country_bps']
      key:
        - 'null:[country:ipsource:both]:unknown'
        - 'null:[country:ipdestination:both]:unknown'
      label: ['src','dst']
      value: ['bytes']
      scale: ['8']
      aggMode: ['sum']
      minValue: ['1000']
      maxFlows: ['100']

  - job_name: 'sflow-rt-asns'
    metrics_path: /app/prometheus/scripts/export.js/flows/ALL/txt
    static_configs:
      - targets: ['sflow-rt:8008']
    params:
      metric: ['sflow_asn_bps']
      key:
        - 'null:[asn:ipsource:both]:unknown'
        - 'null:[asn:ipdestination:both]:unknown'
      label: ['src','dst']
      value: ['bytes']
      scale: ['8']
      aggMode: ['sum']
      minValue: ['1000']
      maxFlows: ['100']
Edit the prometheus/prometheus.yml file and add the above lines to the end of the file.
docker restart prometheus
Restart the prometheus container to pick up the new configuration and start collecting the data.
Add dashboard 11146 to load the sFlow-RT Countries and Networks dashboard.

Getting Started describes how to use the sFlow-RT Flow Browser and Metrics Browser applications to explore the data that is available (the sFlow-RT web interface is exposed on port 8008). Once you have found a useful metric, add it to the set of metrics for Prometheus (the Prometheus web interface is exposed on port 9090) to collect and use Grafana to build dashboards that incorporate the new metrics. Flow metrics with Prometheus and Grafana describes how Prometheus can use sFlow-RT's REST API to define and retrieve traffic flow based metrics like the ones in the Countries and Networks dashboard. 

Sunday, June 11, 2023

Raspberry Pi 4 real-time network analytics

CanaKit Raspberry Pi 4 EXTREME Kit - Aluminum
This article describes how build an inexpensive Raspberry Pi 4 based server for real-time flow analytics of industry standard sFlow streaming telemetry. Support for sFlow is widely implemented in datacenter equipment from vendors including: A10, Arista, Aruba, Cisco, Edge-Core, Extreme, Huawei, Juniper, NEC, Netgear, Nokia, NVIDIA, Quanta, and ZTE.

In this example, we will use an 8G Raspberry Pi 4 running Raspberry Pi OS Lite (64-bit).  The easiest way to format a memory card and install the operating system is to use the Raspberry Pi Imager (shown above).
Click on the gear icon to set a user and password and enable ssh access. These initial settings allow the Rasberry Pi to be accessed over the network without having to attach a screen, keyboard, and mouse.

Next, follow instruction for installing Docker Engine (Raspberry Pi OS Lite is based on Debian 11).

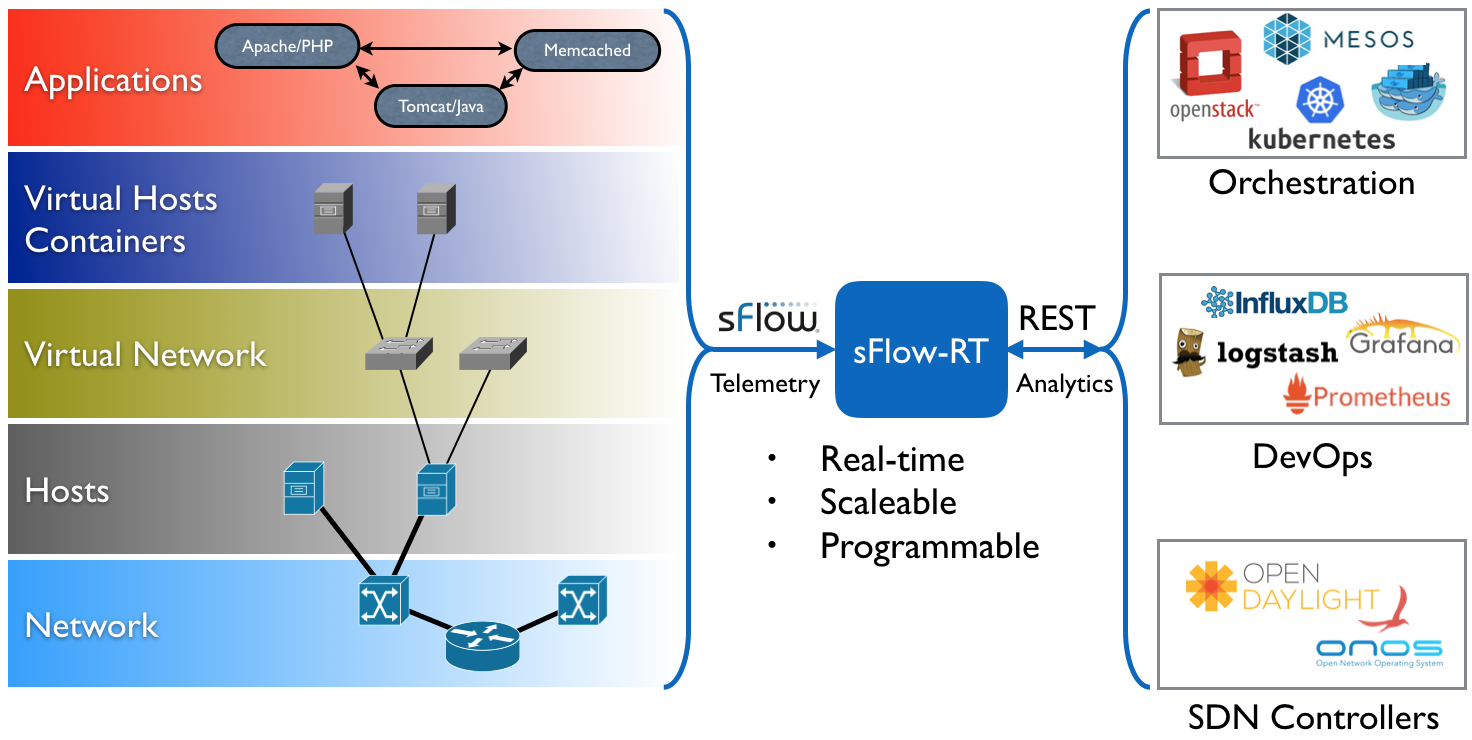
The diagram shows how the sFlow-RT real-time analytics engine receives a continuous telemetry stream from industry standard sFlow instrumentation build into network, server and application infrastructure and delivers analytics through APIs and can easily be integrated with a wide variety of on-site and cloud, orchestration, DevOps and Software Defined Networking (SDN) tools.
docker run -p 6343:6343/udp -p 127.0.0.1:8008:8008 \
--name sflow-rt -d --restart unless-stopped sflow/prometheus
Run the pre-built sflow/prometheus Docker image. In this example access to the user interface is limited to local host in order prevent unauthorized access since no access controls are provided by sFlow-RT.
ssh -L 8008:127.0.0.1:8008 pp@192.168.4.163
Use ssh to connect to the Raspberry Pi (192.168.4.163) and tunnel port 8008 to your laptop.
Access the web interface at http://127.0.0.1:8008/. See Getting Started for instructions for enabling monitoring and browsing metrics. Python is installed by default on Raspberry Pi OS, making it convenient to experiment with the sFlow-RT REST API, see Writing Applications.
If you don't have immediate access to a network and want to experiment, follow the instructions in Leaf and spine network emulation on Mac OS M1/M2 systems to emulate the 5 stage leaf and spine network shown above using Containerlab.
docker stop sflow-rt
Note: If you are going to try the examples, first run the command above to stop the sflow-rt image to avoid port contention when Containerlab starts an instance of sFlow-RT.
The screen capture shows a real-time view of traffic flowing across the the emulated leaf and spine network during a series iperf3 tests. The emulated results are very close to those you can expect when monitoring production traffic on a physical network.

The Raspberry Pi 4 is surprisingly capable, this pocket-sized server can easily monitor hundreds of high speed (100G+) links, providing up to the second visibility into network flows.

Friday, June 3, 2016

Internet of Things (IoT) telemetry

The internet of things (IoT) is the network of physical objects—devices, vehicles, buildings and other items—embedded with electronics, software, sensors, and network connectivity that enables these objects to collect and exchange data. - ITU

The recently released Raspberry Pi Zero (costing $5) is an example of the type of embedded low power computer enabling IoT. These small devices are typically wired to one or more sensors (measuring temperature, humidity, location, acceleration, etc.) and embedded in or attached to physical devices.

Collecting real-time telemetry from large numbers of small devices that may be located within many widely dispersed administrative domains poses a number of challenges, for example:
  • Discovery - How are newly connected devices discovered?
  • Configuration - How can the numerous individual devices be efficiently configured?
  • Transport - How efficiently are measurements transported and delivered?
  • Latency - How long does it take before measurements are remotely accessible? 
This article will use the Raspberry Pi as an example to explore how the architecture of the industry standard sFlow protocol and its implementation in the open source Host sFlow agent provide a method of addressing the challenges of embedded device monitoring.

The following steps describe how to install the Host sFlow agent on Raspbian Jesse (the Debian Linux based Raspberry Pi operating system).
sudo apt-get update
sudo apt-get install libpcap-dev
git clone https://github.com/sflow/host-sflow
sudo make install
The resulting Host sFlow binary is extremely small (only 163,300 bytes in this case):
pi@raspberrypi:~ $ ls -l /usr/sbin/hsflowd 
-rwx------ 1 root root 163300 Jun  1 17:18 /usr/sbin/hsflowd
Next, specify /etc/hsflowd.conf file for the device:
sflow {
  agent = eth0
  agent.cidr=::/0
  DNSSD = on
  DNSSD_domain = .sf.inmon.com
  jsonPort = 36343
  pcap { dev = eth0 }
}
There are a number of important points to note about this configuration:
  • The configuration is not device specific - this same configuration can be pre-loaded in every device.
  • Prefer IPv6 addresses as a way of identifying the agent since they are more likely to be globally unique.
  • DNS Service Discovery (DNS-SD) is used to retrieve dynamic configuration on startup and to periodically refresh the configuration. Hosting a single copy of the configuration (in the form of SRV and TXT records on the DNS server responsible for the sf.inmon.com domain) minimize the complexity of managing large numbers of devices.
  • Network visibility provides a way to monitor the interactions between the devices on the network. The pcap entry enables a Berkeley Packet Filter to efficiently sample network traffic using instrumentation built into the Linux kernel.
  • Custom Metrics can be be sent along with the extensive set of standard sFlow metrics by including the jsonPort entry.
Now start the daemon:
sudo /etc/init.d/hsflowd start
Now add an entry to the sf.inmon.com.zone file on the DNS server:
_sflow._udp   30  SRV     0 0 6343  collector.sf.inmon.com.
In this case, the SRV record specifies that sFlow records should be sent via UDP to collector.sf.inmon.com on port 6343. The TTL is set to 30 seconds so that agents will pick up any changes within 30 seconds. A larger TTL should be used to improve scaleability if there are large numbers of devices.

The following example shows how Custom Metrics can be used to export sensor data. The temp.py script exports the CPU temperature:
#!/usr/bin/env python

import json
import socket

tempC = int(open('/sys/class/thermal/thermal_zone0/temp').read()) / 1e3
msg = {
  "rtmetric": {
    "datasource": "sensors",
    "tempC": { "type": "gaugeFloat", "value": tempC }
  }
}
sock = socket.socket(socket.AF_INET,socket.SOCK_DGRAM)
sock.sendto(json.dumps(msg),("127.0.0.1",36343))
The following crontab entry runs the script every minute:
* * * * * /home/pi/temp.py
The Host sFlow agent will automatically pick up the configuration via a DNS request, start making measurements, which are immediately send in standard sFlow UDP datagrams to the designated sFlow collector collector.sf.inmon.com. sFlow's immediate transmission of measurements minimizes the memory requirements on the agent (since data doesn't have to be stored for later retrieval) and minimizes the latency before measurements are accessible on the collector (and can be acted on).

It should also be noted that all communication is initiated by the device (DNS requests and transmission of telemetry via sFlow). This means that the radio on the device can be powered down between transmissions to save power (and extend battery life if the device is battery powered).
Raspberry Pi real-time network analytics describes how to build a low cost sFlow analyzer using a Raspberry Pi model 3 b and sFlow-RT real-time analytics software. The following command queries the sFlow-RT REST API to show the set of standard metrics being exported by the agent (2001:470:67:27d:d811:aa7e:9e54:30e9):
pi@raspberrypi:~ $ curl http://localhost:8008/metric/2001:470:67:27d:d811:aa7e:9e54:30e9/json
{
 "2.1.bytes_in": 3211.5520193372945,
 "2.1.bytes_out": 462.2822036458858,
 "2.1.bytes_read": 0,
 "2.1.bytes_written": 4537.818511431161,
 "2.1.contexts": 7006.546480008057,
 "2.1.cpu_guest": 0,
 "2.1.cpu_guest_nice": 0,
 "2.1.cpu_idle": 99.17638114546376,
 "2.1.cpu_intr": 0,
 "2.1.cpu_nice": 0,
 "2.1.cpu_num": 4,
 "2.1.cpu_sintr": 0.025342118601115054,
 "2.1.cpu_speed": 0,
 "2.1.cpu_steal": 0,
 "2.1.cpu_system": 0.456158134820071,
 "2.1.cpu_user": 0.3294475418144957,
 "2.1.cpu_utilization": 0.8236188545362393,
 "2.1.cpu_wio": 0.012671059300557527,
 "2.1.disk_free": 24435570688,
 "2.1.disk_total": 29627484160,
 "2.1.disk_utilization": 17.523977160453796,
 "2.1.drops_in": 0,
 "2.1.drops_out": 0,
 "2.1.errs_in": 0,
 "2.1.errs_out": 0,
 "2.1.host_name": "raspberrypi",
 "2.1.icmp_inaddrmaskreps": 0,
 "2.1.icmp_inaddrmasks": 0,
 "2.1.icmp_indestunreachs": 0,
 "2.1.icmp_inechoreps": 0,
 "2.1.icmp_inechos": 0,
 "2.1.icmp_inerrors": 0,
 "2.1.icmp_inmsgs": 0,
 "2.1.icmp_inparamprobs": 0,
 "2.1.icmp_inredirects": 0,
 "2.1.icmp_insrcquenchs": 0,
 "2.1.icmp_intimeexcds": 0,
 "2.1.icmp_intimestamps": 0,
 "2.1.icmp_outaddrmaskreps": 0,
 "2.1.icmp_outaddrmasks": 0,
 "2.1.icmp_outdestunreachs": 0,
 "2.1.icmp_outechoreps": 0,
 "2.1.icmp_outechos": 0,
 "2.1.icmp_outerrors": 0,
 "2.1.icmp_outmsgs": 0,
 "2.1.icmp_outparamprobs": 0,
 "2.1.icmp_outredirects": 0,
 "2.1.icmp_outsrcquenchs": 0,
 "2.1.icmp_outtimeexcds": 0,
 "2.1.icmp_outtimestampreps": 0,
 "2.1.icmp_outtimestamps": 0,
 "2.1.interrupts": 4438.56380300131,
 "2.1.ip_defaultttl": 64,
 "2.1.ip_forwarding": 2,
 "2.1.ip_forwdatagrams": 0,
 "2.1.ip_fragcreates": 0,
 "2.1.ip_fragfails": 0,
 "2.1.ip_fragoks": 0,
 "2.1.ip_inaddrerrors": 0,
 "2.1.ip_indelivers": 9.165072011280088,
 "2.1.ip_indiscards": 0,
 "2.1.ip_inhdrerrors": 0,
 "2.1.ip_inreceives": 9.215429549803606,
 "2.1.ip_inunknownprotos": 0,
 "2.1.ip_outdiscards": 0,
 "2.1.ip_outnoroutes": 0,
 "2.1.ip_outrequests": 2.1653741565112297,
 "2.1.ip_reasmfails": 0,
 "2.1.ip_reasmoks": 0,
 "2.1.ip_reasmreqds": 0,
 "2.1.ip_reasmtimeout": 0,
 "2.1.load_fifteen": 0.05,
 "2.1.load_fifteen_per_cpu": 0.0125,
 "2.1.load_five": 0.02,
 "2.1.load_five_per_cpu": 0.005,
 "2.1.load_one": 0,
 "2.1.load_one_per_cpu": 0,
 "2.1.machine_type": "arm",
 "2.1.mem_buffers": 52133888,
 "2.1.mem_cached": 383287296,
 "2.1.mem_free": 238026752,
 "2.1.mem_shared": 0,
 "2.1.mem_total": 970506240,
 "2.1.mem_used": 297058304,
 "2.1.mem_utilization": 30.608591437339783,
 "2.1.os_name": "linux",
 "2.1.os_release": "4.4.9-v7+",
 "2.1.page_in": 0,
 "2.1.page_out": 2.2157316950347465,
 "2.1.part_max_used": 31.74,
 "2.1.pkts_in": 11.582233860408904,
 "2.1.pkts_out": 2.266089233558264,
 "2.1.proc_run": 1,
 "2.1.proc_total": 237,
 "2.1.read_time": 0,
 "2.1.reads": 0,
 "2.1.swap_free": 104853504,
 "2.1.swap_in": 0,
 "2.1.swap_out": 0,
 "2.1.swap_total": 104853504,
 "2.1.tcp_activeopens": 0,
 "2.1.tcp_attemptfails": 0,
 "2.1.tcp_currestab": 6,
 "2.1.tcp_estabresets": 0,
 "2.1.tcp_incsumerrs": 0,
 "2.1.tcp_inerrs": 0,
 "2.1.tcp_insegs": 2.568234464699365,
 "2.1.tcp_maxconn": 4294967295,
 "2.1.tcp_outrsts": 0,
 "2.1.tcp_outsegs": 1.913586463893645,
 "2.1.tcp_passiveopens": 0,
 "2.1.tcp_retranssegs": 0,
 "2.1.tcp_rtoalgorithm": 1,
 "2.1.tcp_rtomax": 120000,
 "2.1.tcp_rtomin": 200,
 "2.1.udp_incsumerrors": 0,
 "2.1.udp_indatagrams": 6.596837546580723,
 "2.1.udp_inerrors": 0,
 "2.1.udp_noports": 0,
 "2.1.udp_outdatagrams": 0.2517876926175849,
 "2.1.udp_rcvbuferrors": 0,
 "2.1.udp_sndbuferrors": 0,
 "2.1.uptime": 46603,
 "2.1.uuid": "22c4ce8c-067e-4517-8c00-8d822efc4897",
 "2.1.write_time": 8.333333333333334,
 "2.1.writes": 0.6042904622822036,
 "2.ifadminstatus": "up",
 "2.ifdirection": "full-duplex",
 "2.ifindex": "2",
 "2.ifindiscards": 0,
 "2.ifinerrors": 0,
 "2.ifinoctets": 3241.1101037574294,
 "2.ifinpkts": 11.483831973405863,
 "2.ifinucastpkts": 11.483831973405863,
 "2.ifinutilization": 0.025928880830059432,
 "2.ifname": "eth0",
 "2.ifoperstatus": "up",
 "2.ifoutdiscards": 0,
 "2.ifouterrors": 0,
 "2.ifoutoctets": 406.6686813740304,
 "2.ifoutpkts": 1.8636043114737586,
 "2.ifoutucastpkts": 1.8636043114737586,
 "2.ifoututilization": 0.0032533494509922435,
 "2.ifspeed": 100000000,
 "2.iftype": "ethernetCsmacd",
 "sensors.tempC": 49.388
}
Note the custom temperature metric at the end of the list.

In addition, enabling traffic monitoring in the Host sFlow agent provides detailed flow information along with the metrics to provide visibility into interactions between the devices on the network. In this case the wired Ethernet interface (eth0) is being monitored, but monitoring the wireless interface (wlan0) would be a way to gain visibility into messages exchanged over an ad-hoc wireless mesh network connecting devices. RESTflow describes how to perform flow analytics using sFlow-RT.

In conclusion, sFlow provides a standard way to export metrics and traffic information. Most network equipment vendors already provide sFlow support and the technology has a number of architectural features that are well suited to addressing the challenges of extending visibility to and gathering telemetry from large scale IoT deployments.

Wednesday, June 1, 2016

Raspberry Pi real-time network analytics

The Raspberry Pi model 3b is not much bigger than a credit card, costs $35, runs Linux, has a 1G RAM, and powerful 4 core 64 bit ARM processor. This article will demonstrate how to turn the Raspberry Pi into a Terribit/second real-time network analytics engine capable of monitoring hundreds of switches and thousands of switch ports.
The diagram shows how the sFlow-RT real-time analytics engine receives a continuous telemetry stream from industry standard sFlow instrumentation build into network, server and application infrastructure and delivers analytics through APIs and can easily be integrated with a wide variety of on-site and cloud, orchestration, DevOps and Software Defined Networking (SDN) tools.
A future article will examine how the Host sFlow agent can be used to efficiently stream measurements from large numbers of inexpensive Rasberry Pi devices ($5 for model Zero) to the sFlow-RT collector to monitor and control the "Internet of Things" (IoT).
The following instructions show how to install sFlow-RT on Raspbian Jesse (the Debian Linux based Raspberry Pi operating system).
wget http://www.inmon.com/products/sFlow-RT/sflow-rt_2.0-1092.deb
sudo dpkg -i --ignore-depends=openjdk-7-jre-headless sflow-rt_2.0-1092.deb
We are ignoring the dependency on openjdk and will use the default Raspbian Java 1.8 version instead.

Next, edit /usr/local/sflow-rt/conf.d/sflow-rt.jvm and replace the default settings with the following:
-Xms600M
-Xmx600M
-XX:+UseParNewGC
-XX:+UseConcMarkSweepGC
-XX:+CMSIncrementalMode
These new settings reduce the requested memory to fit within the 1G on the Raspberry Pi and leave some memory for system tasks. The G1GC garbage collector not available on ARM Java implementation, so we will use incremental concurrent mark and sweep instead.

Start the sFlow-RT daemon:
sudo service sflow-rt start
The sFlow-RT web interface should now be accessible at http://<raspberrypi_ip>:8008/

Finally, Agents provides information on configuring devices to send sFlow to the Raspberry Pi analyzer. Visit the http://<raspberrypi_ip>:8008/agents/html page to verify that data is being received.

Writing Applications provides an overview of the sFlow-RT APIs. For example, run the following Python script on the Raspberry Pi to log traffic flows that exceed 100Mbits/second:
#!/usr/bin/env python
import requests
import json

rt = 'http://127.0.0.1:8008'

flow = {'keys':'ipsource,ipdestination','value':'bytes'}
requests.put(rt+'/flow/pair/json',data=json.dumps(flow))

threshold = {'metric':'pair','value':100000000/8,'byFlow':True,'timeout':1}
requests.put(rt+'/threshold/elephant/json',data=json.dumps(threshold))

eventurl = rt+'/events/json?thresholdID=elephant&maxEvents=10&timeout=60'
eventID = -1
while 1 == 1:
  r = requests.get(eventurl + "&eventID=" + str(eventID))
  if r.status_code != 200: break
  events = r.json()
  if len(events) == 0: continue

  eventID = events[0]["eventID"]
  events.reverse()
  for e in events:
    print e['flowKey']
In addition, there are a number of open source sFlow-RT Applications available on the Downloads page (e.g. Mininet dashboard, DDoS mitigation, etc.) and articles describing use cases for sFlow-RT on this blog.