Showing posts with label router. Show all posts

Monday, April 4, 2022

Real-time flow telemetry for routers

The last few years have seen leading router vendors add support for sFlow monitoring technology that has long been the industry standard for switch monitoring. Router implementations of sFlow include:
  • Arista 7020R Series Routers, 7280R Series Routers, 7500R Series Routers, 7800R3 Series Routers
  • Cisco 8000 Series Routers, ASR 9000 Series Routers, NCS 5500 Series Routers
  • Juniper ACX Series Routers, MX Series Routers, PTX Series Routers
  • Huawei NetEngine 8000 Series Routers
Broad support of sFlow in both switching and routing platforms ensures comprehensive end-to-end monitoring of traffic, see sFlow.org Network Equipment for a list of vendors and products.
Note: Most routers also support Cisco Netflow/IPFIX. Rapidly detecting large flows, sFlow vs. NetFlow/IPFIX describes why you should choose sFlow if you are interested in real-time monitoring and control applications.
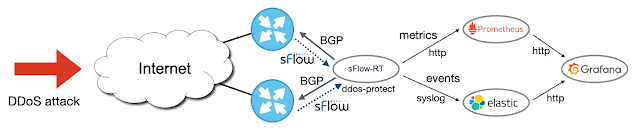
DDoS mitigation is a popular use case for sFlow telemetry in routers. The combination of sFlow for real-time DDoS detection with BGP RTBH / Flowspec mitigation on routing platforms makes for a compelling solution.
DDoS protection quickstart guide describes how to deploy sFlow along with BGP RTBH/Flowspec to automatically detect and mitigate DDoS flood attacks. The use of sFlow provides sub-second visibility into network traffic during the periods of high packet loss experienced during a DDoS attack. The result is a system that can reliably detect and respond to attacks in real-time.

The following links provide detailed configuration examples:

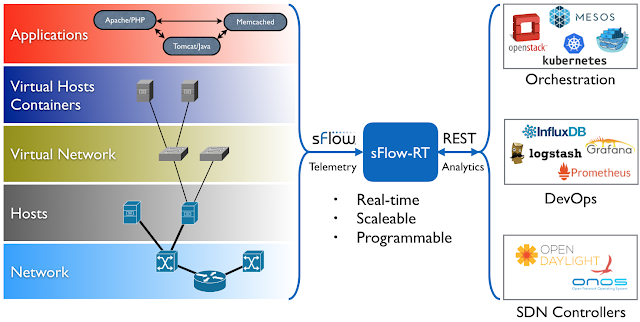
The examples above make use of the sFlow-RT real-time analytics platform, which provides real-time visibility to drive Software Defined Networking (SDN), DevOps and Orchestration tasks.

Tuesday, February 8, 2022

Cisco NCS 5500 Series Routers

Cisco already supports industry standard sFlow telemetry across a range of products and the recent IOS-XR Release 7.5.1 extends support to Cisco NCS 5500 series routers.

Note: The NCS 5500 series routers also support Cisco Netflow. Rapidly detecting large flows, sFlow vs. NetFlow/IPFIX describes why you should choose sFlow if you are interested in real-time monitoring and control applications.
The following commands configure an NCS 5500 series router to sample packets at 1-in-20,000 and stream telemetry to an sFlow analyzer (192.127.0.1) on UDP port 6343.
flow exporter-map SF-EXP-MAP-1
 version sflow v5
 !
 packet-length 1468
 transport udp 6343
 source GigabitEthernet0/0/0/1
 destination 192.127.0.1
 dfbit set
!

Configure the sFlow analyzer address in an exporter-map.

flow monitor-map SF-MON-MAP
 record sflow
 sflow options
  extended-router
  extended-gateway
  if-counters polling-interval 300
  input ifindex physical
  output ifindex physical
 !
 exporter SF-EXP-MAP-1
!

Configure sFlow options in a monitor-map.

sampler-map SF-SAMP-MAP
 random 1 out-of 20000
!

Define the sampling rate in a sampler-map.

interface GigabitEthernet0/0/0/3
 flow datalinkframesection monitor-map SF-MON-MAP sampler SF-SAMP-MAP ingress

Enable sFlow on each interface for complete visibilty into network traffic.

The diagram shows the general architecture of an sFlow monitoring deployment. All the switches stream sFlow telemetry to a central sFlow analyzer for network wide visibililty. Host sFlow agents installed on servers can extend visibilty into the compute infrastructure, and provide network visibility from virtual machines in the public cloud. In this instance, the sFlow-RT real-time analyzer provides an up to the second view of performance that is used to drive operational dashboards and network automation. The recommended sFlow configuration settings are optimized for real-time monitoring of the large scale networks targetted by Cisco NCS 5500 series routers.

docker run -p 8008:8008 -p 6343:6343/udp sflow/prometheus

Getting started with sFlow-RT is very simple, for example, the above command uses the pre-built sflow/prometheus Docker image to start analyzing sFlow. Real-time DDoS mitigation using BGP RTBH and FlowSpec, Monitoring leaf and spine fabric performance, and Flow metrics with Prometheus and Grafana describe additional use cases for real-time sFlow analytics.

Note: There is a wide range of options for sFlow analysis. See sFlow Collectors for a list of open source and commercial software.

Cisco first introduced sFlow support in the Nexus 3000 Series in 2012. Today, there is a range of Cisco products that include sFlow support. The broad support for sFlow by Cisco and other leading vendors (e.g. A10, Arista, Aruba, Edge-Core, Extreme, Huawei,  Juniper, NEC, Netgear, Nokia, NVIDIA, Quanta, and ZTE) makes sFlow an attractive option for multi-vendor network performance monitoring, particularly for those interested in real-time monitoring and automation.

Thursday, January 13, 2022

Cisco ASR 9000 Series Routers

Cisco already supports industry standard sFlow telemetry across a range of products and the recent IOS-XR Release 7.5.1 extends support to Cisco ASR 9000 Series Routers.

Note: The ASR 9000 series routers also support Cisco Netflow. Rapidly detecting large flows, sFlow vs. NetFlow/IPFIX describes why you should choose sFlow if you are interested in real-time monitoring and control applications.

The following commands configure an ASR 9000 series router to sample packets at 1-in-20,000 and stream telemetry to an sFlow analyzer (192.127.0.1) on UDP port 6343.

flow exporter-map SF-EXP-MAP-1
 version sflow v5
 !
 packet-length 1468
 transport udp 6343
 source GigabitEthernet0/0/0/1
 destination 192.127.0.1
 dfbit set
!

Configure the sFlow analyzer address in an exporter-map.

flow monitor-map SF-MON-MAP
 record sflow
 sflow options
  extended-router
  extended-gateway
  if-counters polling-interval 300
  input ifindex physical
  output ifindex physical
 !
 exporter SF-EXP-MAP-1
!

Configure sFlow options in a monitor-map.

sampler-map SF-SAMP-MAP
 random 1 out-of 20000
!

Define the sampling rate in a sampler-map.

interface GigabitEthernet0/0/0/3
 flow datalinkframesection monitor-map SF-MON-MAP sampler SF-SAMP-MAP ingress

Enable sFlow on each interface for complete visibilty into network traffic.

The diagram shows the general architecture of an sFlow monitoring deployment. All the switches stream sFlow telemetry to a central sFlow analyzer for network wide visibililty. Host sFlow agents installed on servers can extend visibilty into the compute infrastructure, and provide network visibility from virtual machines in the public cloud. In this instance, the sFlow-RT real-time analyzer provides an up to the second view of performance that is used to drive operational dashboards and network automation. The recommended sFlow configuration settings are optimized for real-time monitoring of the large scale networks targetted by Cisco ASR 9000 series routers.

docker run -p 8008:8008 -p 6343:6343/udp sflow/prometheus

Getting started with sFlow-RT is very simple, for example, the above command uses the pre-built sflow/prometheus Docker image to start analyzing sFlow. Real-time DDoS mitigation using BGP RTBH and FlowSpec, Monitoring leaf and spine fabric performance, and Flow metrics with Prometheus and Grafana describe additional use cases for real-time sFlow analytics.

Note: There is a wide range of options for sFlow analysis. See sFlow Collectors for a list of open source and commercial software.

Cisco first introduced sFlow support in the Nexus 3000 Series in 2012. Today, there is a range of Cisco products that include sFlow support. The broad support for sFlow by Cisco and other leading vendors (e.g. A10, Arista, Aruba, Edge-Core, Extreme, Huawei,  Juniper, NEC, Netgear, Nokia, NVIDIA, Quanta, and ZTE) makes sFlow an attractive option for multi-vendor network performance monitoring, particularly for those interested in real-time monitoring and automation.

Monday, May 3, 2021

Cisco 8000 Series routers


Cisco 8000 Series routers are "400G optimized platforms that scale from 10.8 Tbps to 260 Tbps." The routers are built around Cisco Silicon One™ ASICs. The Silicon One ASIC includes the instrumentation needed to support industry standard sFlow real-time streaming telemetry.
Note: The Cisco 8000 Series routers also support Cisco Netflow. Rapidly detecting large flows, sFlow vs. NetFlow/IPFIX describes why you should choose sFlow if you are interested in real-time monitoring and control applications.
The following commands configure a Cisco 8000 series router to sample packets at 1-in-20,000 and stream telemetry to an sFlow analyzer (192.127.0.1) on UDP port 6343.
flow exporter-map SF-EXP-MAP-1
 version sflow v5
 !
 packet-length 1468
 transport udp 6343
 source GigabitEthernet0/0/0/1
 destination 192.127.0.1
 dfbit set
!

Configure the sFlow analyzer address in an exporter-map.

flow monitor-map SF-MON-MAP
 record sflow
 sflow options
  extended-router
  extended-gateway
  if-counters polling-interval 300
  input ifindex physical
  output ifindex physical
 !
 exporter SF-EXP-MAP-1
!

Configure sFlow options in a monitor-map.

sampler-map SF-SAMP-MAP
 random 1 out-of 20000
!

Define the sampling rate in a sampler-map.

interface GigabitEthernet0/0/0/3
 flow datalinkframesection monitor-map SF-MON-MAP sampler SF-SAMP-MAP ingress

Enable sFlow on each interface for complete visibilty into network traffic.

The above configuration instructions are for IOS-XR. Cisco goes SONiC on Cisco 8000 describes Cisco's suppport for the open source SONiC network operating system. SONiC describes how sFlow is implemented and configured on SONiC.

The diagram shows the general architecture of an sFlow monitoring deployment. All the switches stream sFlow telemetry to a central sFlow analyzer for network wide visibililty. Host sFlow agents installed on servers can extend visibilty into the compute infrastructure, and provide network visibility from virtual machines in the public cloud. In this instance, the sFlow-RT real-time analyzer provides an up to the second view of performance that can be used to drive operational dashboards and network automation. The recommended sFlow configuration settings are optimized for real-time monitoring of the large scale networks targetted by Cisco 8000 routers.

docker run -p 8008:8008 -p 6343:6343/udp sflow/prometheus

Getting started with sFlow-RT is very simple, for example, the above command uses the pre-built sflow/prometheus Docker image to start analyzing sFlow. Real-time DDoS mitigation using BGP RTBH and FlowSpec, Monitoring leaf and spine fabric performance, and Flow metrics with Prometheus and Grafana describe additional use cases for real-time sFlow analytics.

Note: There is a wide range of options for sFlow analysis. See sFlow Collectors for a list of open source and commercial software.

Cisco first introduced sFlow support in the Nexus 3000 Series in 2012. Today, there is a range of Cisco products that include sFlow support. The inclusion of sFlow instrumentation in Silicon One is likely expand support across the range of upcoming products based on these ASICs. The broad support for sFlow by Cisco and other leading vendors (e.g. A10, Arista, Aruba, Cumulus, Edge-Core, Extreme, Huawei,  Juniper, NEC, Netgear, Nokia, Quanta, and ZTE) makes sFlow an attractive option for multi-vendor network performance monitoring, particularly for those interested in real-time monitoring and automation.

Wednesday, July 11, 2018

sFlow available on Juniper PTX series routers


sFlow functionality introduced on the PTX1000 and PTX10000 platforms—Starting in Junos OS Release 18.2R1, the PTX1000 and PTX10000 routers support sFlow, a network monitoring protocol for high-speed networks. With sFlow, you can continuously monitor tens of thousands of ports simultaneously. The mechanism used by sFlow is simple, not resource intensive, and accurate.  - New and Changed Features

The recent article, sFlow available on Juniper MX series routers, describes how Juniper is extending sFlow support to include routers to provide visibility across their entire range of switching and routing products.

Universal support for industry standard sFlow as a base Junos feature reduces the operational complexity and cost of network visibility for enterprises and service providers. Real-time streaming telemetry from campus switches, routers, and data center switches, provides centralized, real-time, end-to-end visibility needed to troubleshoot, optimize, and account for network usage.

Analytics software is a critical factor in realizing the full benefits of sFlow monitoring. Choosing an sFlow analyzer discusses important factors to consider when selecting from the range of open source and commercial sFlow analysis tools.

Friday, April 6, 2018

sFlow available on Juniper MX series routers

sFlow support on MX Series devices—Starting in Junos OS Release 18.1R1, you can configure sFlow technology (as a sFlow agent) on a MX Series device, to continuously monitor traffic at wire speed on all interfaces simultaneously. The sFlow technology is a monitoring technology for high-speed switched or routed networks.  - New and Changed Features

Understanding How to Use sFlow Technology for Network Monitoring on a MX Series Router lists the following benefits of sFlow Technology on a MX Series Router:
  • sFlow can be used by software tools like a network analyzer to continuously monitor tens of thousands of switch or router ports simultaneously.
  • Since sFlow uses network sampling (forwarding one packet from ‘n’ number of total packets) for analysis, it is not resource intensive (for example processing, memory and more). The sampling is done at the hardware application-specific integrated circuits (ASICs) and hence it is simple and more accurate.
With the addition of the MX series routers, Juniper now supports sFlow across its entire product range:
Universal support for industry standard sFlow as a base Junos feature reduces the operational complexity and cost of network visibility for enterprises and service providers. Real-time streaming telemetry from campus switches, routers, and data center switches, provides centralized, real-time, end-to-end visibility needed to troubleshoot, optimize, and account for network usage.
Analytics software is a critical factor in realizing the full benefits of sFlow monitoring. Choosing an sFlow analyzer discusses important factors to consider when selecting from the range of open source and commercial sFlow analysis tools.

Thursday, December 1, 2016

IPv6 Internet router using merchant silicon

Internet router using merchant silicon describes how a commodity white box switch can be used as a replacement for an expensive Internet router. The solution combines standard sFlow instrumentation implemented in merchant silicon with BGP routing information to selectively install only active routes into the hardware.

The article describes a simple self contained solution that uses standard APIs and should be able to run on a variety of Linux based network operating systems, including: Cumulus Linux, Dell OS10, Arista EOS, and Cisco NX-OS.

The diagram shows the elements of the solution. Standard sFlow instrumentation embedded in the merchant silicon ASIC data plane in the white box switch provides real-time information on traffic flowing through the switch. The sFlow agent is configured to send the sFlow to an instance of sFlow-RT running on the switch. The Bird routing daemon is used to handle the BGP peering sessions and to install routes in the Linux kernel using the standard netlink interface. The network operating system in turn programs the switch ASIC with the kernel routes so that packets are forwarded by the switch hardware and not by the kernel software.

The key to this solution is Bird's multi-table capabilities. The full Internet routing table learned from BGP peers is installed in a user space table that is not reflected into the kernel. A BGP session between sFlow-RT analytics software and Bird allows sFlow-RT to see the full routing table and combine it with the sFlow telemetry to perform real-time BGP route analytics and identify the currently active routes. A second BGP session allows sFlow-RT to push routes to Bird which in turn pushes the active routes to the kernel, programming the ASIC.

This article extends the previous example to add IPv6 routing. In this example, the following Bird configuration, /etc/bird/bird6.conf, was installed on the switch:
# Please refer to the documentation in the bird-doc package or BIRD User's
# Guide on http://bird.network.cz/ for more information on configuring BIRD and
# adding routing protocols.

# Change this into your BIRD router ID. It's a world-wide unique identification
# of your router, usually one of router's IPv6 addresses.
router id 10.0.0.136;

# The Kernel protocol is not a real routing protocol. Instead of communicating
# with other routers in the network, it performs synchronization of BIRD's
# routing tables with the OS kernel.
protocol kernel {
 scan time 60;
        scan time 2;
 import all;
 export all;
}

# The Device protocol is not a real routing protocol. It doesn't generate any
# routes and it only serves as a module for getting information about network
# interfaces from the kernel. 
protocol device {
 scan time 60;
}

protocol direct {
        interface "*";
}

# Create a new table (disconnected from kernel/master) for peering routes
table peers;

protocol bgp peer_65134 {
  table peers;
  igp table master;
  local as 65136;
  neighbor fc00:136::2 as 65134;
  source address fc00:136::1;
  import all;
  export all;
}

protocol bgp peer_65135 {
  table peers;
  igp table master;
  local as 65136;
  neighbor fc00:136::3 as 65135;
  source address fc00:136::1;
  import all;
  export all;
}

# Copy default route from peers table to master table
protocol pipe {
  table peers;
  peer table master;
  import none;
  export filter {
     if net ~ [ ::/0 ] then accept;
     reject;
  };
}

# Reflect peers table to sFlow-RT
protocol bgp to_sflow_rt {
  table peers;
  igp table master;
  local as 65136;
  neighbor ::1 port 1179 as 65136;
  import none;
  export all;
}

# Receive active prefixes from sFlow-RT
protocol bgp from_sflow_rt {
  local as 65136;
  neighbor fc00:136::1 port 1179 as 65136;
  import all;
  export none;
}
The open source Active Route Manager (ARM) application has been installed in sFlow-RT and the following sFlow-RT configuration, /usr/local/sflow-rt/conf.d/sflow-rt.conf, adds the IPv6 BGP route reflector and control sessions with Bird:
bgp.start=yes
arm.reflector.ip=127.0.0.1
arm.reflector.ip6=::1
arm.reflector.as=65136
arm.reflector.id=0.0.0.1
arm.sflow.ip=10.0.0.136
arm.target.ip = 10.0.0.136
arm.target.ip6=fc00:136::1
arm.target.as=65136
arm.target.id=0.0.0.2
arm.target.prefixes=10000
arm.target.prefixes6=5000
Once configured, operation is entirely automatic. As soon as traffic starts flowing to a new route, the route is identified and installed in the ASIC. If the route later becomes inactive, it is automatically removed from the ASIC to be replaced with a different active route. In this case, the maximum number of routes allowed in the ASIC has been specified as 5,000. This number can be changed to reflect the capacity of the hardware.
The Active Route Manager application has a web interface that provides up to the second visibility into the number of routes, routes installed in hardware, amount of traffic, hardware and software resource utilization etc. In addition, the sFlow-RT REST API can be used to make additional queries.

Wednesday, July 20, 2016

Internet router using Cumulus Linux

Internet router using merchant silicon describes how an inexpensive white box switch running Linux can be used to replace a much costlier Internet router. This article will describe the steps needed to install the software on an x86 based white box switch running Cumulus Linux 3.0.

First, add the Debian Jessie repository:
sudo sh -c 'echo "deb http://ftp.us.debian.org/debian jessie main contrib" > \
/etc/apt/sources.list.d/deb.list'
Next, install Host sFlow, Java, and Bird:
sudo apt-get update
sudo apt-get install hsflowd
sudo apt-get install unzip
sudo apt-get install default-jre-headless
sudo apt-get install bird
Install sFlow-RT (the latest version is available at sFlow-RT.com):
wget http://www.inmon.com/products/sFlow-RT/sflow-rt_2.0-1116.deb
sudo dpkg -i sflow-rt_2.0-1116.deb
Increase the default virtual memory limit for sflowrt (needs to be greater than 1/3 amount of RAM on system to start Java virtual machine, see Giant Bug: Cannot run java with a virtual mem limit (ulimit -v)):
sudo sh -c 'echo "sflowrt soft as 2000000" > \
/etc/security/limits.d/99-sflowrt.conf'
Note: Maximum Java heap memory has a default of 1G and is controlled by settings in /usr/local/sflow-rt/conf.d/sflow-rt.jvm file.

Install the Active Route Manager application:
sudo sh -c "/usr/local/sflow-rt/get-app.sh sflow-rt active-routes"
Cumulus Networks, sFlow and data center automation describes how to configure the sFlow agent (hsflowd). The sFlow collector address should be set to 127.0.0.1.

Finally, configure Bird and sFlow-RT as described in Internet router using merchant silicon.

The instructions were tested on a Cumulus VX virtual machine, but should work on physical switches. Cumulus VX is free and provides a convenient way to try out Cumulus Linux and create virtual networks to test configurations.

If you are going to experiment with the solution on CumulusVX then the following command is needed to enable sFlow traffic monitoring:
sudo iptables -I FORWARD -j NFLOG --nflog-group 1 --nflog-prefix SFLOW
On physical switches the sFlow agent automatically configures packet sampling in the ASIC and is able to monitor all packets (not just the routed packets captured by the iptables command above).

Friday, July 15, 2016

Internet router using merchant silicon

SDN router using merchant silicon top of rack switch and Dell OS10 SDN router demo discuss how an inexpensive white box switch running Linux can be used to replace a much costlier Internet router. The key to this solution is the observation that, while the full Internet routing table of over 600,000 routes is too large to fit in white box switch hardware, only a small fraction of the routes carry most of the traffic. Traffic analytics allows the active routes to be identified and installed in the hardware.

This article describes a simple self contained solution that uses standard APIs and should be able to run on a variety of Linux based network operating systems, including: Cumulus Linux, Dell OS10, Arista EOS, and Cisco NX-OS. The distinguishing feature of this solution is its real-time response, where previous solutions respond to changes in traffic within minutes or hours, this solution updates hardware routes within seconds.

The diagram shows the elements of the solution. Standard sFlow instrumentation embedded in the merchant silicon ASIC data plane in the white box switch provides real-time information on traffic flowing through the switch. The sFlow agent is configured to send the sFlow to an instance of sFlow-RT running on the switch. The Bird routing daemon is used to handle the BGP peering sessions and to install routes in the Linux kernel using the standard netlink interface. The network operating system in turn programs the switch ASIC with the kernel routes so that packets are forwarded by the switch hardware and not by the kernel software.

The key to this solution is Bird's multi-table capabilities. The full Internet routing table learned from BGP peers is installed in a user space table that is not reflected into the kernel. A BGP session between sFlow-RT and Bird allows sFlow-RT to see the full routing table and combine it with the sFlow telemetry to perform real-time BGP route analytics and identify the currently active routes. A second BGP session allows sFlow-RT to push routes to Bird which in turn pushes the active routes to the kernel, programming the ASIC.

In this example, the following Bird configuration, /etc/bird/bird.conf, was installed on the switch:
# Please refer to the documentation in the bird-doc package or BIRD User's
# Guide on http://bird.network.cz/ for more information on configuring BIRD and
# adding routing protocols.

# Change this into your BIRD router ID. It's a world-wide unique identification
# of your router, usually one of router's IPv4 addresses.
router id 10.0.0.136;

# The Kernel protocol is not a real routing protocol. Instead of communicating
# with other routers in the network, it performs synchronization of BIRD's
# routing tables with the OS kernel.
protocol kernel {
  learn;
  scan time 2;
  import all;
  export all;   # Actually insert routes into the kernel routing table
}

# The Device protocol is not a real routing protocol. It doesn't generate any
# routes and it only serves as a module for getting information about network
# interfaces from the kernel. 
protocol device {
  scan time 60;
}

protocol direct {
  interface "*";
}

# Create a new table (disconnected from kernel/master) for peering routes
table peers;

# Create BGP sessions with peers
protocol bgp peer_65134 {
  table peers;
  igp table master;
  local as 65136;
  neighbor 10.0.0.134 as 65134;
  import all;
  export all;
}

protocol bgp peer_65135 {
  table peers;
  igp table master;
  local as 65136;
  neighbor 10.0.0.135 as 65135;
  import all;
  export all;
}

# Copy default route from peers table to master table
protocol pipe {
  table peers;
  peer table master;
  import none;
  export filter {
     if net ~ [ 0.0.0.0/0 ] then accept;
     reject;
  };
}

# Reflect peers table to sFlow-RT
protocol bgp to_sflow_rt {
  table peers;
  igp table master;
  local as 65136;
  neighbor 127.0.0.1 port 1179 as 65136;
  import none;
  export all;
}

# Receive active prefixes from sFlow-RT
protocol bgp from_sflow_rt {
  local as 65136;
  neighbor 10.0.0.136 port 1179 as 65136;
  import all;
  export none;
}
The open source Active Route Manager (ARM) application has been installed in sFlow-RT and the following sFlow-RT configuration, /usr/local/sflow-rt/conf.d/sflow-rt.conf, enables the BGP route reflector and control sessions with Bird:
bgp.start=yes
arm.reflector.ip=127.0.0.1
arm.reflector.as=65136
arm.reflector.id=0.0.0.1
arm.sflow.ip=10.0.0.136
arm.target.ip = 10.0.0.136
arm.target.as=65136
arm.target.id=0.0.0.2
arm.target.prefixes=10000
Once configured, operation is entirely automatic. As soon as traffic starts flowing to a new route, the route is identified and installed in the ASIC. If the route later becomes inactive, it is automatically removed from the ASIC to be replaced with a different active route. In this case, the maximum number of routes allowed in the ASIC has been specified as 10,000. This number can be changed to reflect the capacity of the hardware.
The Active Route Manager application has a web interface that provides up to the second visibility into the number of routes, routes installed in hardware, amount of traffic, hardware and software resource utilization etc. In addition, the sFlow-RT REST API can be used to make additional queries.

Tuesday, June 14, 2016

Merchant silicon based routing, flow analytics, and telemetry

Drivers for growth describes how switches built on merchant silicon from Broadcom ASICs dominate the current generation of data center switches, reduce hardware costs, and support an open ecosystem of switch operating systems (Cumulus Linux, OpenSwitch, Dell OS10, Broadcom FASTPATH, Pica8 PicOS, Open Network Linux, etc.).

The router market is poised to be similarly disrupted with the introduction of devices based on Broadcom's Jericho ASIC, which has the capacity to handle over 1 million routes in hardware (the full Internet routing table is currently around 600,000 routes).
An edge router is a very pricey box indeed, often costing anywhere from $100,000 to $200,000 per 100 Gb/sec port, depending on features in the router and not including optical cables that are also terribly expensive. Moreover, these routers might only be able to cram 80 ports into a half rack or full rack of space. The 7500R universal spine and 7280R universal leaf switches cost on the order of $3,000 per 100 Gb/sec port, and they are considerably denser and less expensive. - Leaving Fixed Function Switches Behind For Universal Leafs
Broadcom Jericho ASICs are currently available in Arista 7500R/7280R routers and in Cisco NCS 5000 series routers. Expect further disruption to the router market when white box versions of the 1U router hardware enter the market.
There was general enthusiasm for Broadcom Jericho based routers in a recent discussion on the North American Network Operators' Group (NANOG) mailing list, Arista Routing Solutions, so merchant silicon based routers should be expected to sell well.
The Broadcom Jericho ASICs also include hardware instrumentation to support industry standard sFlow traffic monitoring and streaming telemetry. For example, the following commands enable sFlow on all ports on an Arista router:
sflow source-interface Management1
sflow destination 170.1.1.11
sflow polling-interval 30
sflow sample 65535
sflow run
See EOS System Configuration Guide for details.

While Cisco supports standard sFlow on merchant silicon based switch platforms, see Cisco adds sFlow support, Cisco adds sFlow support to Nexus 9K series, and Cisco SF250, SG250, SF350, SG350, SG350XG, and SG550XG series switches. Unfortunately, IOS XR on Cisco's Jericho based routers doesn't yet support sFlow. Instead, a complex set of commands is required to configure Cisco's proprietary NetFlow and streaming telemetry protocols:
RP/0/RP0/CPU0:router#config
RP/0/RP0/CPU0:router(config)#flow exporter-map exp1
RP/0/RP0/CPU0:router(config-fem)#version v9
RP/0/RP0/CPU0:router(config-fem-ver)#options interface-table timeout 300
RP/0/RP0/CPU0:router(config-fem-ver)#options sampler-table timeout 300
RP/0/RP0/CPU0:router(config-fem-ver)#template data timeout 300
RP/0/RP0/CPU0:router(config-fem-ver)#template options timeout 300
RP/0/RP0/CPU0:router(config-fem-ver)#exit 
RP/0/RP0/CPU0:router(config-fem)#transport udp 12515
RP/0/RP0/CPU0:router(config-fem)#source Loopback0
RP/0/RP0/CPU0:router(config-fem)#destination 170.1.1.11
RP/0/RP0/CPU0:router(config-fmm)#exit
RP/0/RP0/CPU0:router(config)#flow monitor-map MPLS-IPv6-fmm
RP/0/RP0/CPU0:router(config-fmm)#record mpls ipv6-fields labels 3
RP/0/RP0/CPU0:router(config-fmm)#exporter exp1
RP/0/RP0/CPU0:router(config-fmm)#cache entries 10000
RP/0/RP0/CPU0:router(config-fmm)#cache permanent
RP/0/RP0/CPU0:router(config-fmm)#exit
RP/0/RP0/CPU0:router(config)#sampler-map FSM
RP/0/RP0/CPU0:router(config-sm)#random 1 out-of 65535
RP/0/RP0/CPU0:router(config-sm)# exit
And further commands are needed to enable monitoring on each interface (and there can be a large number of interfaces given the high port density of these routers):
RP/0/RP0/CPU0:router(config)#interface HundredGigE 0/3/0/0
RP/0/RP0/CPU0:router(config-if)#flow mpls monitor MPLS-IPv6-fmm sampler FSM ingress
See Netflow Configuration Guide for Cisco NCS 5500 Series Routers, IOS XR Release 6.0.x for configuration details and limitations.

We are still not done, further steps are required to enable the equivalent to sFlow's streaming telemetry.

Create policy file defining the counters to export:
{
 "Name": "Test",
 "Metadata": {
  "Version": 25,
  "Description": "This is a sample policy",
  "Comment": "This is the first draft",
  "Identifier": "data that may be sent by the encoder to the mgmt stn"
 },
 "CollectionGroups": {
  "FirstGroup": {
  "Period": 30,
  "Paths": [
   "RootOper.InfraStatistics.Interface(*).Latest.GenericCounters"
   ]
  }
 }
}
Copy the policy file to router:
$ scp Test.policy cisco@170.1.1.1:/telemetry/policies
Finally, configure the JSON encoder:
Router# configure
Router(config)#telemetry encoder json
Router(config-telemetry-json)#policy group FirstGroup
Router(config-policy-group)#policy Test
Router(config-policy-group)#destination ipv4 170.1.1.11 port 5555
Router(config-policy-group)#commit
See Cisco IOS XR Telemetry Configuration Guide for details.
Software defined analytics describes how the sFlow architecture disaggregates the flow analytics pipeline and integrates telemetry export to reduce complexity and increase flexibility. The reduced configuration complexity is clearly illustrated by the two configuration examples above.

Unlike the complex and disparate monitoring mechanisms in IOS XR, sFlow offers a simple, flexible and unified monitoring solution that exposes the full monitoring capabilities of the Broadcom Jericho ASIC. Expect a future release of IOS XR to add the sFlow support since sFlow a natural fit for the hardware capabilities of Jericho based router platforms and the addition of sFlow support will provide feature parity with Cisco's merchant silicon based switches.

Finally, the real-time visibility provided by sFlow supports a number of important use cases for high performance routers, including:
  • DDoS mitigation
  • Load balancing ECMP paths
  • BGP route analytics
  • Traffic engineering
  • Usage based accounting
  • Enforcing usage quotas

Friday, January 22, 2016

Dell OS10 SDN router demo


In this video from Dell's Network Field Day 11 (#NFD11) presentation,  Madhu Santhanam demonstrates an interesting use case for the new OS10 switch operating system that was introduced at the event.
The core of OS10 is an unmodified Linux kernel with an application development environment for Control Plane Services (CPS). These APIs allow software running on the switch: native linux applications, third party applications, and native OS10 applications to run on the core OS10 operating system.
The FIB Optimization application consists of three components: an sFlow agent to provide network visibility, Quagga for BGP routing, and the Selective Route Push agent which provides a REST API for selectively populating the hardware routing tables in the switch ASIC. The FIB Optimization application allows an inexpensive data center switch to replace a much more expensive high capacity Internet router.
In this use case, the data center is connected to a single transit provider and multiple additional peer networks. Initially all traffic is sent via a default route to the transit provider. The full Internet routing table consists of nearly 600,000 prefixes - far too many to fit in the switch hardware forwarding tables which in typical low cost switches can only handle 20,000 - 30,000 routes.

However, for any given site, only a small number the advertised prefixes are destinations for traffic. The challenge is to identify the most active prefixes so that they can be selectively installed in hardware tables. In this demonstration sFlow-RT is used to process the industry standard sFlow telemetry exported by the sFlow agent on the switch and compute the top N active prefixes. Every minute active prefixes installed and inactive prefixes are removed from the hardware using the Selective Route Push REST API.
In the demo, an IXIA traffic generator simulates a mixture of traffic to 1 peer and to other prefixes handled by the transit provides. Initially, all traffic is sent to the transit provider, but after a minute 76% of the traffic is being directed to the peer, and after two minutes over 90% of the traffic is being directed to the peer. As traffic patterns change, prefixes are automatically added and removed from the hardware forwarding table.

Analytics driven SDN is poised to disrupt the router market, replacing expensive, custom hardware with commodity switches. Solutions like the one Dell presented are already in production. Last year, David Barroso gave a talk showing that 99% of Spotify’s Internet traffic was contained in only 20,000 prefixes and started the  SDN Internet Router project which similarly combines BGP routing information with sFlow telemetry, but only updates the active routes every hour. In the Dell demo, updates occur every minute. The speed of response can be increased even further, the sFlow-RT Active Route Manager application detects and updates active routes within a second. Speed is important since the faster the application can react to changing traffic, the more effectively the hardware forwarding, opening up additional use cases for SDN routing.

Wednesday, October 28, 2015

Active Route Manager

SDN Active Route Manager has been released on GitHub, https://github.com/sflow-rt/active-routes. The software is based on the article White box Internet router PoC. Active Route Manager peers with a BGP route reflector to track prefixes and combines routing data with sFlow measurements to identify the most active prefixes. Active prefixes can be advertised via BGP to a commodity switch, which acts as a hardware route cache, accelerating the performance of a software router.
There is an interesting parallel with the Open vSwitch architecture, see Open vSwitch performance monitoring, which maintains a cache of active flows in the Linux kernel to accelerate forwarding. In the SDN routing case, active prefixes are pushed to the switch ASIC in order to bypass the slower software router.
In this example, the software is being used in passive mode, estimating the cache hit / miss rates without offloading routes. The software has been configured to manage a cache of 10,000 prefixes. The first screen shot shows the cache warming up.

The first panel shows routes being learned from the route reflector: the upper chart shows the approximately 600,000 routes being learned from the BGP route reflector, and the lower chart shows the rate at which routes are being added (peaking at just over 300,000 prefixes per second).

The second panel shows traffic analytics: the top chart shows how many of the prefixes are seeing traffic (shown in blue) as well as the number inactive prefixes that are covered by the active prefixes (shown in red). The lower chart shows the percentage of traffic destined to the active prefixes.

The third panel shows the behavior of the cache: the upper chart shows the total number of prefixes in the cache, the middle chart, the rate of prefix additions / removals from the cache, and the lower chart shows the cache miss rate, dropping to less than 10% within a couple of seconds of the BGP route reflector session being established.
The second screen shot shows the cache a few minutes later once it has warmed up and is in steady state. There are approximately 10,000 prefixes in the cache with prefixes being added and removed as traffic patterns change and routes are added and dropped. The estimated cache miss rate is less than 0.5% and misses are mostly due to newly active prefixes rather than recently deleted cache entries.

This example is a further demonstration that it is possible to use SDN analytics and control to combine the standard sFlow and BGP capabilities of commodity switch hardware and deliver Terabit routing capacity.

Tuesday, July 21, 2015

White box Internet router PoC

SDN router using merchant silicon top of rack switch describes how the performance of a software Internet router could be accelerated using the hardware routing capabilities of a commodity switch. This article describes a proof of concept demonstration using Linux virtual machines and a bare metal switch running Cumulus Linux.
The diagram shows the demo setup, providing inter-domain routing between Peer 1 and Peer 2. The Peers are directly connected to the Hardware Switch and ingress packets are routed by the default (0.0.0.0/0) route to the Software Router. The Software Router learns the full set of routes from the Peers using BGP and forwards the packet to the correct next hop router. The packet is then switched to the selected peer router via bridge br_xen.

The following traceroute run on Peer 1 shows the set of router hops from 192.168.250.1 to 192.168.251.1
[root@peer1 ~]# traceroute -s 192.168.250.1 192.168.251.1
traceroute to 192.168.251.1 (192.168.251.1), 30 hops max, 40 byte packets
 1  192.168.152.2 (192.168.152.2)  3.090 ms  3.014 ms  2.927 ms
 2  192.168.150.3 (192.168.150.3)  3.377 ms  3.161 ms  3.099 ms
 3  192.168.251.1 (192.168.251.1)  6.440 ms  6.228 ms  3.217 ms
Ensuring that packets are first forwarded by the default route on the Hardware Switch is the key to accelerating forwarding decisions for the Software Router. Any specific routes added to Hardware Switch will override the default route and matching packets will bypass the Software Router and will be forwarded by the Hardware Switch.

In this test bench, routing is performed using Quagga instances running on Peer 1, Peer 2, Hardware Switch and Software Router.

Peer 1

router bgp 150
 bgp router-id 192.168.150.1
 network 192.168.250.0/24
 neighbor 192.168.152.3 remote-as 152
 neighbor 192.168.152.3 ebgp-multihop 2

Peer 2

router bgp 151
 bgp router-id 192.168.151.1
 network 192.168.251.0/24
 neighbor 192.168.152.3 remote-as 152
 neighbor 192.168.152.3 ebgp-multihop 2

Software Router

interface lo
  ip address 192.168.152.3/32

router bgp 152
 bgp router-id 192.168.152.3
 neighbor 192.168.150.1 remote-as 150
 neighbor 192.168.150.1 update-source 192.168.152.3
 neighbor 192.168.150.1 passive
 neighbor 192.168.151.1 remote-as 151
 neighbor 192.168.151.1 update-source 192.168.152.3
 neighbor 192.168.151.1 passive
 neighbor 10.0.0.162 remote-as 152
 neighbor 10.0.0.162 port 1179
 neighbor 10.0.0.162 timers connect 30
 neighbor 10.0.0.162 route-reflector-client

Hardware Switch

router bgp 65000
 bgp router-id 0.0.0.1
 neighbor 10.0.0.162 remote-as 65000
 neighbor 10.0.0.162 port 1179
 neighbor 10.0.0.162 timers connect 30
In addition, the following lines in /etc/network/interfaces configure the bridge:
auto br_xen
iface br_xen
  bridge-ports swp1 swp2 swp3
  address 192.168.150.2/24
  address 192.168.151.2/24
  address 192.168.152.2/24
Cumulus Networks, sFlow and data center automation describes how to configure sFlow monitoring on Cumulus Linux switches. The switch is configured to send sFlow to 10.0.0.162 (the host running the SDN controller).

SDN Routing Application


SDN router using merchant silicon top of rack switch describes how to install sFlow-RT and provides an application for pushing active routes to an accelerator. The application has been modified for this setup and is running on host 10.0.0.162:
bgpAddNeighbor('10.0.0.152',152);
bgpAddNeighbor('10.0.0.233',65000);
bgpAddSource('10.0.0.233','10.0.0.152',10);

var installed = {};
setIntervalHandler(function() {
  let now = Date.now();
  let top = bgpTopPrefixes('10.0.0.152',20000,1);
  if(!top || !top.hasOwnProperty('topPrefixes')) return;

  let tgt = bgpTopPrefixes('10.0.0.233',0);
  if(!tgt || 'established' != tgt.state) return;

  for(let i = 0; i < top.topPrefixes.length; i++) {
     let entry = top.topPrefixes[i];
     if(bgpAddRoute('10.0.0.233',entry)) {
       installed[entry.prefix] = now; 
     }
  }
  for(let prefix in installed) {
     let time = installed[prefix];
     if(time === now) continue;
     if(bgpRemoveRoute('10.0.0.233',prefix)) {
        delete installed[prefix];
     } 
  }
}, 1);
Start the application:
$ ./start.sh 
2015-07-21T19:36:52-0700 INFO: Listening, BGP port 1179
2015-07-21T19:36:52-0700 INFO: Listening, sFlow port 6343
2015-07-21T19:36:53-0700 INFO: Starting the Jetty [HTTP/1.1] server on port 8008
2015-07-21T19:36:53-0700 INFO: Starting com.sflow.rt.rest.SFlowApplication application
2015-07-21T19:36:53-0700 INFO: Listening, http://localhost:8008
2015-07-21T19:36:53-0700 INFO: bgp.js started
2015-07-21T19:36:57-0700 INFO: BGP open /10.0.0.152:50010
2015-07-21T19:37:23-0700 INFO: BGP open /10.0.0.233:55097
Next, examine the routing table on the Hardware Switch:
cumulus@cumulus$ ip route
default via 192.168.152.1 dev br_xen 
10.0.0.0/24 dev eth0  proto kernel  scope link  src 10.0.0.233 
192.168.150.0/24 dev br_xen  proto kernel  scope link  src 192.168.150.2 
192.168.151.0/24 dev br_xen  proto kernel  scope link  src 192.168.151.2 
192.168.152.0/24 dev br_xen  proto kernel  scope link  src 192.168.152.2
This is the default set of routes  configured to pass traffic to and from the Software Router.

To generate traffic using iperf, run the following command on Peer 2:
iperf -s -B 192.168.251.1
And generate traffic with the following command on Peer 1:
iperf -c 192.168.251.1 -B 192.168.250.1
Now check the routing table on the Hardware Switch again:
cumulus@cumulus$ ip route
default via 192.168.152.1 dev br_xen 
10.0.0.0/24 dev eth0  proto kernel  scope link  src 10.0.0.233  
192.168.150.0/24 dev br_xen  proto kernel  scope link  src 192.168.150.2 
192.168.151.0/24 dev br_xen  proto kernel  scope link  src 192.168.151.2 
192.168.152.0/24 dev br_xen  proto kernel  scope link  src 192.168.152.2 
192.168.250.0/24 via 192.168.150.1 dev br_xen  proto zebra  metric 20 
192.168.251.0/24 via 192.168.151.1 dev br_xen  proto zebra  metric 20
Note the two hardware routes that have been added by the SDN controller. The route override can be verified by repeating the traceroute test:
[root@peer1 ~]# traceroute -s 192.168.250.1 192.168.251.1
traceroute to 192.168.251.1 (192.168.251.1), 30 hops max, 40 byte packets
 1  192.168.150.2 (192.168.150.2)  3.260 ms  3.151 ms  3.014 ms
 2  192.168.251.1 (192.168.251.1)  4.418 ms  4.351 ms  4.260 ms
Comparing with the original traceroute, notice that packets bypass the Software Router interface (192.168.150.3) and are forwarded entirely in hardware.

The traffic analytics driving the forwarding decisions can be viewed through the sFlow-RT REST API:
$ curl http://10.0.0.162:8008/bgp/topprefixes/10.0.0.52/json
{
 "as": 152,
 "direction": "destination",
 "id": "192.168.152.3",
 "learnedPrefixesAdded": 2,
 "learnedPrefixesRemoved": 0,
 "nPrefixes": 2,
 "pushedPrefixesAdded": 0,
 "pushedPrefixesRemoved": 0,
 "startTime": 1437535255553,
 "state": "established",
 "topPrefixes": [
  {
   "aspath": "150",
   "localpref": 100,
   "med": 0,
   "nexthop": "192.168.150.1",
   "origin": "IGP",
   "prefix": "192.168.250.0/24",
   "value": 1.4462334178258518E7
  },
  {
   "aspath": "151",
   "localpref": 100,
   "med": 0,
   "nexthop": "192.168.151.1",
   "origin": "IGP",
   "prefix": "192.168.251.0/24",
   "value": 391390.33359066787
  }
 ],
 "valuePercentCoverage": 100,
 "valueTopPrefixes": 1.4853724511849185E7,
 "valueTotal": 1.4853724511849185E7
}
The SDN application automatically removes routes from the hardware once they become idle, or to make room for more active routes if the hardware routing table exceeds the set limit of 20,000 routes, or if they are withdrawn. This switch has a maximum capacity of 32,768 routes and standard sFlow analytics can be used to monitor hardware table utilizations - Broadcom ASIC table utilization metrics, DevOps, and SDN.
The test setup was configured to quickly test the concept using limited hardware at hand and can be improved for production deployment (using smaller CIDRs and VLANs to separate peer traffic).
This proof of concept demonstrates that it is possible to use SDN analytics and control to combine standard sFlow and BGP capabilities of commodity hardware and deliver Terabit routing capacity with just a few thousand dollars of hardware.

Tuesday, July 14, 2015

SDN router using merchant silicon top of rack switch

The talk from David Barroso describes how Spotify optimizes hardware routing on a commodity switch by using sFlow analytics to identify the routes carrying the most traffic.  The full Internet routing table contains nearly 600,000 entries, too many for commodity switch hardware to handle. However, not all entries are active all the time. The Spotify solution uses traffic analytics to track the 30,000 most active routes (representing 6% of the full routing table) and push them into hardware. Based on Spotify's experience, offloading the active 30,000 routes to the switch provides hardware routing for 99% of their traffic.

David is interviewed by Ivan Pepelnjak,  SDN ROUTER @ SPOTIFY ON SOFTWARE GONE WILD. The SDN Internet Router (SIR) source code and documentation is available on GitHub.
The diagram from David's talk shows the overall architecture of the solution. Initially the Internet Router (commodity switch hardware) uses a default route to direct outbound traffic to a Transit Provider (capable of handling all the outbound traffic). The BGP Controller learns routes via BGP and observes traffic using the standard sFlow measurement technology embedded with most commodity switch silicon.
After a period (1 hour) the BGP Controller identifies the most active 30,000 prefixes and configures the Internet Router to install these routes in the hardware so that traffic takes the best routes to each peer. Each subsequent period provides new measurements and the controller adjusts the active set of routes accordingly.
The internals of the BGP Controller are shown in this diagram. BGP and sFlow data are received by the pmacct traffic accounting software, which then writes out files containing traffic by prefix. The bgpc.py script calculates the TopN prefixes and installs them in the Internet Router. 
In this example, the Bird routing daemon is running on the Internet Router and the TopN prefixes are written into a filter file that restricts prefixes that can be installed in the hardware. 
The SIR router demonstrates that building an SDN controller that leverages standard measurement and control capabilities of commodity hardware has the potential to disrupt the router market by replacing expensive custom routers with inexpensive commodity switches based on merchant silicon. However, the relatively slow feedback loop (updating measurements every hour) limits SIR to access routers with relatively stable traffic patterns.

The rest of this article discusses how a fast feedback loop can be built combining real-time sFlow analytics with a BGP control plane. A fast feedback loop significantly reduces the number hardware cache misses and increase the scaleability of the solution, allowing a broader range of use cases to be addressed.

This diagram differs from the SIR router, re-casting the role of the hardware Switch as an accelerator that handles forwarding for a subset of prefixes in order to reduce the traffic forwarded by a Router implementing the full Internet routing table. Applications for this approach include taking an existing router and boosting its throughput (e.g. boosting 1Gigabit router to 100Gigabit), or, more disruptively, replacing an expensive hardware router with a commodity Linux server.
Route caching is not a new idea, the paper, Revisiting Route Caching: The World Should Be Flat, discusses the history of route caching and discusses applications to contemporary workloads and requirements.
The throughput increase is determined by the cache hit rate that can be achieved with the limited number of routing entries supported by the switch hardware. For example, if the hardware achieves a 90% cache hit rate, then only 10% of the traffic is handled by the router and the throughput is boosted by a factor of 10.

A fast control loop is critical to increasing the cache hit rate, rapidly detecting traffic to new destination prefixes and installing hardware forwarding entries that minimize traffic through the router.

The sFlow-RT analytics software already provides real-time (sub-second) traffic analytics and recently added experimental BGP support allows sFlow-RT to act as a route reflector client, learning the full set of prefixes so that it can track traffic rates by prefix.

The following steps are required to try out the software.

First download sFlow-RT.
wget http://www.inmon.com/products/sFlow-RT/sflow-rt.tar.gz
tar -xvzf sflow-rt.tar.gz
cd sflow-rt
Next configure sFlow-RT to listen for BGP connections. In this case, add the following entries to the start.sh file to enable BGP, listening on port 1179 rather than the well known BGP port 179 so that sFlow-RT does not need to run with root privileges:
-Dbgp.start=yes -Dbgp.port=1179
Edit, the init.js file and use the bgpAddNeighbor function to peer with the Router (10.0.0.254) where NNNN is the local autonomous system (AS) number and the bgpAddNeighbor function to combine sFlow data from the Switch (10.0.0.253) with the routing table, tracking bytes/second and using a 10 second moving average:
bgpAddNeighbor('10.0.0.254',NNNN);
bgpAddSource('10.0.0.253','10.0.0.254',10,'bytes');
Configure the Switch to send sFlow to sFlow-RT (see Switch configurations).

Configure the Router as a route reflector, connecting to sFlow-RT (10.0.0.252) and exporting the full routing table. For example, using Quagga as the routing daemon:
router bgp NNNN
 bgp router-id 10.0.0.254
 neighbor 10.0.0.252 remote-as NNNN
 neighbor 10.0.0.252 port 1179
 neighbor 10.0.0.252 route-reflector-client
Start sFlow-RT:
./start.sh
The following cURL command accesses the sFlow-RT REST API to query the TopN prefixes:
curl "http://10.0.0.162:8008/bgp/topprefixes/10.0.0.30/json?direction=destination&maxPrefixes=5&minValue=1"
{
 "as": NNNN,
 "direction": "destination",
 "id": "N.N.N.N",
 "learnedPrefixesAdded": 568313,
 "learnedPrefixesRemoved": 9,
 "nPrefixes": 567963,
 "pushedPrefixesAdded": 0,
 "pushedPrefixesRemoved": 0,
 "startTime": 1436830843625,
 "state": "established",
 "topPrefixes": [
  {
   "aspath": "NNNN",
   "localpref": 888,
   "nexthop": "N.N.N.N",
   "origin": "IGP",
   "prefix": "0.0.0.0/0",
   "value": 680740.5504781345
  },
  {
   "aspath": "NNNN-NNNN",
   "localpref": 100,
   "nexthop": "N.N.N.N",
   "origin": "IGP",
   "prefix": "N.N.0.0/14",
   "value": 58996.251739893225
  },
  {
   "aspath": "NNNN-NNNNN",
   "localpref": 130,
   "nexthop": "N.N.N.N",
   "origin": "IGP",
   "prefix": "N.N.0.0/13",
   "value": 7966.802831354894
  },
  {
   "localpref": 100,
   "med": 2,
   "nexthop": "N.N.N.N",
   "origin": "IGP",
   "prefix": "N.N.N.0/18",
   "value": 3059.8853014045844
  },
  {
   "aspath": "NNNN",
   "localpref": 1010,
   "med": 0,
   "nexthop": "N.N.N.N",
   "origin": "IGP",
   "prefix": "N.N.N.0/24",
   "value": 1635.0250535959976
  }
 ],
 "valuePercentCoverage": 99.67670497397555,
 "valueTopPrefixes": 752398.5154043833,
 "valueTotal": 754838.871931838
}

In addition to returning the top prefixes, the query returns information about the amount of traffic covered by these prefixes. In this case, the valuePercentageCoverage of 99.67 indicates that 99.67 percent of the traffic is covered by the top 5 prefixes.
Try running this query on your own network to find out how many prefixes are required to cover 90%, 95%, and 99% of the traffic. If you have results you can share, please post them as comments to this article.
Obtaining the TopN prefixes is only part of the SDN routing application. An efficient method of installing the TopN prefixes in the switch hardware is also required . The SIR router uses a configuration file, but this approach doesn't work well for rapidly modifying large tables. In addition, configuration files vary between routers, limiting the portability of the controller.

In addition to listening for routes using BGP, sFlow-RT can also act as a BGP speaker. The following init.js script implements a basic hardware route cache:

bgpAddNeighbor('10.0.0.254',65000);
bgpAddSource('10.0.0.253','10.0.0.254',10,'bytes');
bgpAddNeighbor('10.0.0.253',65000);

var installed = {};
setIntervalHandler(function() {
  let now = Date.now();
  let top = bgpTopPrefixes('10.0.0.254',100,1,'destination');
  if(!top || !top.hasOwnProperty('topPrefixes')) return;

  let tgt = bgpTopPrefixes('10.0.0.253',0);
  if(!tgt || 'established' != tgt.state) return;

  for(let i = 0; i < top.topPrefixes.length; i++) {
     let entry = top.topPrefixes[i];
     if(bgpAddRoute('10.0.0.253',entry)) {
       installed[entry.prefix] = now; 
     }
  }
  for(let prefix in installed) {
     let time = installed[prefix];
     if(time === now) continue;
     if(bgpRemoveRoute('10.0.0.253',prefix)) {
        delete installed[prefix];
     } 
  }
}, 5);
Some notes on the script:
  1. setIntervalHandler registers a function that is called every 5 seconds
  2. The interval handler queries for the top 100 destination prefixes
  3. Active prefixes are pushed to the switch using bgpAddRoute
  4. Inactive prefixes are withdrawn using bgpRemoveRoute
  5. The bgpAddRoute/bgpRemoveRoute functions are BGP session state aware and will only forward changes

The initial BGP functionality is fairly limited (no IPv6, no communities, ..) and experimental, please report any bugs here, or on the sFlow-RT group.

Try out the software and provide feedback. This example was only one use case for combining sFlow and BGP in an SDN controller. Other use cases include inbound / outbound traffic engineering, DDoS mitigation, multi-path load balancing, etc. Finally, the combination of commodity hardware with mature, widely deployed BGP and sFlow protocols is a pragmatic approach to SDN that allows solutions to be developed rapidly and deployed widely in production environments.

Saturday, March 20, 2010

Host sFlow


Virtualization extends networking into servers through virtual switches, virtual routers and virtual firewalls. The sFlow standard, already built into most vendor's switches, provides visibility and control of traffic on the physical network. As virtual device vendors implement sFlow (e.g. Open vSwitch and Vyatta), visibility is extended into the virtual network on the server. The implementation of sFlow monitoring on servers offers an opportunity to extend visibility into server performance.

Monitoring physical and virtual server performance is a challenging task. Consider that the number of virtual machines per server is going up, currently 20-40 virtual machines per physical machine is not unusual. Monitoring a data center with 10,000 physical switch ports might involve monitoring as many as 5,000 physical servers, 10,000 virtual switches, 200,000 virtual switch ports and 100,000 virtual servers.

The proven scalability of sFlow's counter polling mechanism offers an efficient way to monitor the large number physical and virtual servers in a data center. The Host sFlow extension, currently being developed on sFlow.org, offers a standard way to export physical and virtual server performance statistics (i.e. CPU, memory and I/O metrics).

Host sFlow integrates with sFlow in physical and virtual switches to unify network and system visibility, helping to break down management silos and provide the end-to-end visibility into data center resources needed for effective management and control.

Feb. 15, 2011 Update: To find more recent articles on using sFlow to monitor servers, click on the server label below.

Monday, February 1, 2010

Virtual routing


The diagram shows networking elements within a virtual server. The server's physical network adapters connect to LAN switches that provide a high speed, flat, layer 2, fabric connecting servers and storage in the data center. Virtual switches provide shared access to the physical adapters, connecting the virtual network adapters in the virtual machines to the physical network.

Current hierarchical network designs confine routing to specialized hardware at the core of the network.  It is worth re-examining the place of routing given the changes in data center architecture brought about by convergence and virtualization. What if routing could be virtualized?

The performance of software routers running on commodity x86 hardware is improving,  Vyatta recently announced 20 Gbps routing performance from their software routers. With network adapter support for virtualization (e.g. SR-IOV), it is now feasible to implement high-performance routing and firewall functionality in virtual machines.

Virtualization of routing offers a number of advantages:
  1. Virtualization allows services to be replicated and deployed where they are needed in the virtual infrastructure. A virtual router can easily be replicated to provide redundancy or add capacity.
  2. Virtual routing can provide better reliability and lower costs by making use of the general purpose virtual server infrastructure, eliminating the need for expensive, specialized router hardware.
  3. Distributing routing to the edge of the network reduces pressure on the core and improves scalability. 
There benefits don't just apply to routing, many other specialized devices can also be virtualized, including firewalls, load balancers, proxies etc. Virtualization of layer 3-7 network devices on a high performance converged Ethernet fabric offers a flexible and dynamic infrastructure that can easily be reconfigured to meet changing demands.

To illustrate the potential of virtualized networking, consider the example of a hosted data center. In a typical hosted data center, customers have racks or partial racks of equipment installed in the data center. A typical customer will have their own router, firewall, load balancer and servers installed in the rack. A virtual rack can be constructed by deploying routing and firewall virtual machines along with general purpose virtual machines that the customer can use to deploy their applications. A virtual rack can be provisioned and maintained automatically, providing customers with much more responsive service while reducing operating costs. In addition, virtualization allows higher customer densities per physical rack, increasing the revenue that can be generated per rack.

The benefits aren't restricted to service provider networks. In enterprise data centers, the flexibility of virtualized networking allows for more efficient management and utilization of resources. However, a barrier to realizing these benefits is the current siloed approach to data center management. Close coordination is needed between network and system management teams. For example, who would be responsible for provisioning and configuring a virtual router? This type of cross functional task is a challenge for most organizations.

Integrated traffic monitoring provides the visibility needed for effective management of virtualized networks. The diagram shows some of the data paths that are possible in a virtual stack: the red line shows traffic between two physical VLANs connected by a virtual router and the gold line shows traffic routed between two virtual machines hosted on the same server. In order to provide network visibility, every networking device, physical or virtual needs to include integrated traffic monitoring so that all traffic paths can be observed. Shared visibility into all resources in the data center ensures that each group (network, systems and storage) is aware of its impact on shared resources, eliminates finger pointing, improves coordination and lays the foundation for automating control.

There are many proprietary and standard technologies for embedded traffic monitoring. Broadly speaking these fall into two classes, TCP/IP flow monitoring built into many routers (e.g. Cisco NetFlow) and multi-protocol packet-based monitoring built into most switches. Convergence in both the LAN (data center bridging) and the WAN (Metro Ethernet and Carrier Ethernet) is taking place using Ethernet technologies, making the sFlow standard the logical choice for visibility since it enjoys broad, multi-vendor support and is already built into most vendor's Ethernet products. Just as convergence to Ethernet simplifies connectivity, convergence to sFlow standard monitoring built into Ethernet devices simplifies management of the converged network.

Products incorporating the sFlow standard provide visibility throughout the physical switch, virtual switchvirtual router and cloud layers, delivering the end to end visibility needed to realize the full benefits of virtualization and convergence.