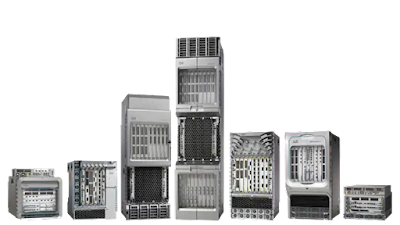
Cisco already supports industry standard sFlow telemetry across a range of products and the recent IOS-XR Release 7.5.1 extends support to Cisco ASR 9000 Series Routers.
Note: The ASR 9000 series routers also support Cisco Netflow. Rapidly detecting large flows, sFlow vs. NetFlow/IPFIX describes why you should choose sFlow if you are interested in real-time monitoring and control applications.
The following commands configure an ASR 9000 series router to sample packets at 1-in-20,000 and stream telemetry to an sFlow analyzer (192.127.0.1) on UDP port 6343.
flow exporter-map SF-EXP-MAP-1
 version sflow v5
 !
 packet-length 1468
 transport udp 6343
 source GigabitEthernet0/0/0/1
 destination 192.127.0.1
 dfbit set
!
Configure the sFlow analyzer address in an exporter-map.
flow monitor-map SF-MON-MAP
 record sflow
 sflow options
  extended-router
  extended-gateway
  if-counters polling-interval 300
  input ifindex physical
  output ifindex physical
 !
 exporter SF-EXP-MAP-1
!
Configure sFlow options in a monitor-map.
sampler-map SF-SAMP-MAP
 random 1 out-of 20000
!
Define the sampling rate in a sampler-map.
interface GigabitEthernet0/0/0/3
 flow datalinkframesection monitor-map SF-MON-MAP sampler SF-SAMP-MAP ingress
Enable sFlow on each interface for complete visibilty into network traffic.
The diagram shows the general architecture of an sFlow monitoring deployment. All the switches stream sFlow telemetry to a central sFlow analyzer for network wide visibililty. Host sFlow agents installed on servers can extend visibilty into the compute infrastructure, and provide network visibility from virtual machines in the public cloud. In this instance, the sFlow-RT real-time analyzer provides an up to the second view of performance that is used to drive operational dashboards and network automation. The recommended sFlow configuration settings are optimized for real-time monitoring of the large scale networks targetted by Cisco ASR 9000 series routers.
docker run -p 8008:8008 -p 6343:6343/udp sflow/prometheus
Getting started with sFlow-RT is very simple, for example, the above command uses the pre-built sflow/prometheus Docker image to start analyzing sFlow. Real-time DDoS mitigation using BGP RTBH and FlowSpec, Monitoring leaf and spine fabric performance, and Flow metrics with Prometheus and Grafana describe additional use cases for real-time sFlow analytics.
Note: There is a wide range of options for sFlow analysis. See sFlow Collectors for a list of open source and commercial software.
Cisco first introduced sFlow support in the Nexus 3000 Series in 2012. Today, there is a range of Cisco products that include sFlow support. The broad support for sFlow by Cisco and other leading vendors (e.g. A10, Arista, Aruba, Edge-Core, Extreme, Huawei, Juniper, NEC, Netgear, Nokia, NVIDIA, Quanta, and ZTE) makes sFlow an attractive option for multi-vendor network performance monitoring, particularly for those interested in real-time monitoring and automation.


No comments:
Post a Comment