Observability in Data Center Networks: In this session, you’ll learn how the sFlow protocol provides broad visibility in modern data center environments as they migrate to highly meshed topologies. Our data center workloads are shifting to take advantage of higher speeds and bandwidth, so visibility to east-west traffic within the data center is becoming more important. Join Peter Phaal—one of the inventors of sFlow—and Joe Reves from SolarWinds product management as they discuss how sFlow differs from other flow instrumentation to deliver visibility in the switching fabric.THWACKcamp is SolarWinds’ free, annual, worldwide virtual IT learning event connecting thousands of skilled IT professionals with industry experts and SolarWinds technical staff. This video was one of the sessions.

Telemetry, analytics, and control with sFlow® standard
Showing posts with label ECMP. Show all posts
Showing posts with label ECMP. Show all posts
Wednesday, October 30, 2019
Observability in Data Center Networks


Thursday, November 15, 2018
Mininet, ONOS, and segment routing

This article will describe how to emulate a leaf and spine network using Mininet and configure the ONOS segment routing application to provide equal cost multi-path (ECMP) routing of flows across the fabric. The Mininet Dashboard application running on the sFlow-RT real-time analytics platform is used to provide visibility into traffic flows across the emulated network.
First, run ONOS using Docker:
docker run --name onos --rm -p 6653:6653 -p 8181:8181 -d onosproject/onosUse the graphical interface, http://onos:8181, to enable the OpenFlow Provider Suite, Network Config Host Provider, Network Config Link Provider, and Segment Routing applications. The screen shot above shows the resulting set of enabled services.
Next, install sFlow-RT and the Mininet Dashboard application on host with Mininet:
wget https://inmon.com/products/sFlow-RT/sflow-rt.tar.gz
tar -xvzf sflow-rt.tar.gz
./sflow-rt/get-app.sh sflow-rt mininet-dashboard
Start sFlow-RT:
./sflow-rt/start.shDownload the sr.py script:
wget https://raw.githubusercontent.com/sflow-rt/onos-sr/master/sr.pyStart Mininet:
sudo env ONOS=10.0.0.73 mn --custom sr.py,sflow-rt/extras/sflow.py \
--link tc,bw=10 --topo=sr '--controller=remote,ip=$ONOS,port=6653'
The sr.py script is used to create a leaf and spine topology in Mininet and send the network configuration to the ONOS controller. The sflow.py script enables sFlow monitoring of the switches and sends the network topology to sFlow-RT.
The leaf and spine topology will appear in the ONOS web interface.


mininet> iperf h1 h3The path that the traffic takes is highlighted on the Mininet Dashboard topology:


See Writing Applications for an introduction to programming sFlow-RT's analytics engine. Mininet flow analytics provides a simple example of detecting large (elephant) flows.
Thursday, July 19, 2018
ExtremeXOS 22.5.1 adds support Broadcom ASIC table utilization statistics

Figure 1 shows the packet processing pipeline of a Broadcom ASIC. The pipeline consists of a number of linked hardware tables providing bridging, routing, access control list (ACL), and ECMP forwarding group functions. Operations teams need to be able to proactively monitor table utilizations in order to avoid performance problems associated with table exhaustion.
Broadcom's sFlow specification, sFlow Broadcom Switch ASIC Table Utilization Structures, leverages the industry standard sFlow protocol to offer scaleable, multi-vendor, network wide visibility into the utilization of these hardware tables.
The following output from the open source sflowtool command line utility shows the raw table measurements (this is in addition to the extensive set of measurements already exported via sFlow by ExtremeXOS):
bcm_asic_host_entries 4
bcm_host_entries_max 8192
bcm_ipv4_entries 0
bcm_ipv4_entries_max 0
bcm_ipv6_entries 0
bcm_ipv6_entries_max 0
bcm_ipv4_ipv6_entries 9
bcm_ipv4_ipv6_entries_max 16284
bcm_long_ipv6_entries 3
bcm_long_ipv6_entries_max 256
bcm_total_routes 10
bcm_total_routes_max 32768
bcm_ecmp_nexthops 0
bcm_ecmp_nexthops_max 2016
bcm_mac_entries 3
bcm_mac_entries_max 32768
bcm_ipv4_neighbors 4
bcm_ipv6_neighbors 0
bcm_ipv4_routes 0
bcm_ipv6_routes 0
bcm_acl_ingress_entries 842
bcm_acl_ingress_entries_max 4096
bcm_acl_ingress_counters 68
bcm_acl_ingress_counters_max 4096
bcm_acl_ingress_meters 18
bcm_acl_ingress_meters_max 8192
bcm_acl_ingress_slices 3
bcm_acl_ingress_slices_max 8
bcm_acl_egress_entries 36
bcm_acl_egress_entries_max 512
bcm_acl_egress_counters 36
bcm_acl_egress_counters_max 1024
bcm_acl_egress_meters 18
bcm_acl_egress_meters_max 512
bcm_acl_egress_slices 2
bcm_acl_egress_slices_max 2
The sflowtool output is useful for troubleshooting and is easy to parse with scripts.
A convenient way to run sflowtool is to use Docker:
docker run -p 6343:6343/udp sflow/sflowtool
Ethernet Fabric Visibility
 |
| Ethernet Fabrics: Extreme Networks ExtremeFabric |
Fabric View solves the visibility challenge by using the industry standard sFlow instrumentation built into data center switches. Fabric View represents the fabric as if it were a single large chassis switch, treating each leaf switch as a line card and the spine switches as the backplane. The result is an intuitive tool that is easily understood by anyone familiar with traditional networks.
A demonstration can be run using Docker:
docker run --entrypoint /sflow-rt/run_demo.sh -p 8008:8008 sflow/fabric-viewAccess the web interface on port 8008.


sFlow-RT
FabricView is one of a number of applications developed for sFlow-RT. Examples include: DDoS mitigation, Internet routing using top of rack switches, and other articles on this blog.
Thursday, March 22, 2018
OCP Summit 2018
The following articles on this blog cover related topics:
- Streaming telemetry
- InBand network telemetry
- Black hole detection
- Troubleshooting connectivity problems in leaf and spine fabrics
- Monitoring leaf and spine fabric performance
- Leaf and spine traffic engineering using segment routing and SDN
- Marking large flows
- Broadcom BroadView Instrumentation
- Broadcom ASIC table utilization metrics, DevOps, and SDN
- Lasers!

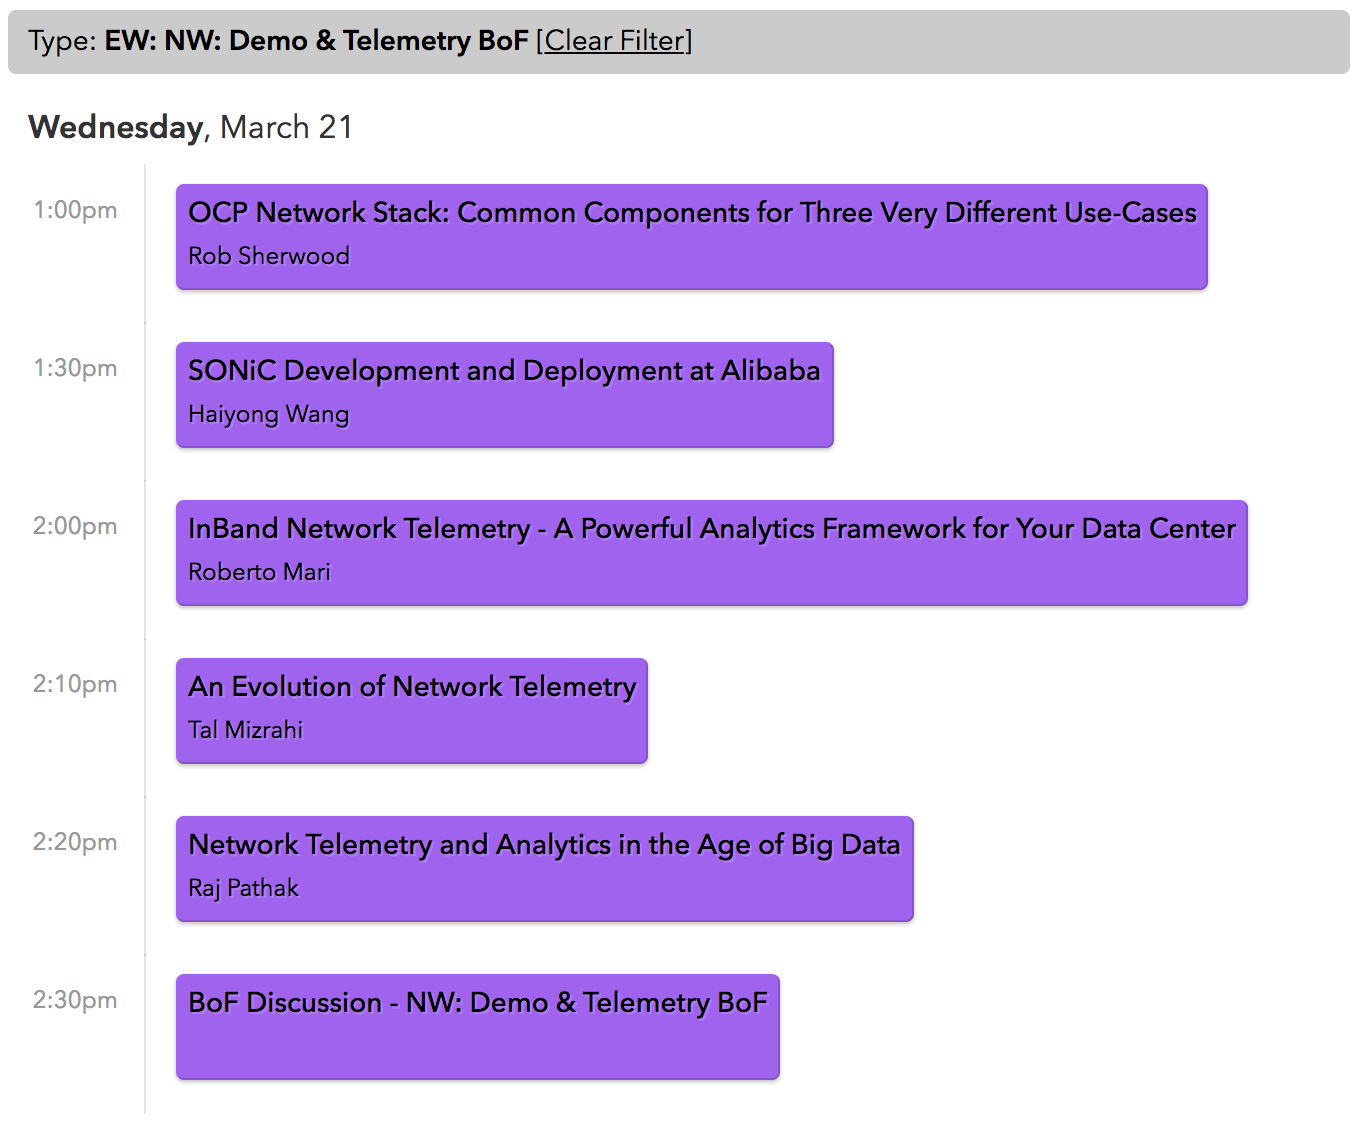
The rack in the booth contains a two spine, five leaf network. Each of the switches in the network is streaming real-time sFlow telemetry to an instance of Fabric View which is displaying real-time (up to the second) flow analytics on the monitor to the right of the picture.

Tuesday, September 5, 2017
Troubleshooting connectivity problems in leaf and spine fabrics

Unlike traditional hierarchical network designs, where a small number of links can be monitored to provide visibility, a leaf and spine network has no special links or switches where running CLI commands or attaching a probe would provide visibility. Even if it were possible to attach probes, the effective bandwidth of a leaf and spine network can be as high as a Petabit/second, well beyond the capabilities of current generation monitoring tools.
Fortunately, industry standard sFlow monitoring technology is built into the commodity switch hardware used to build leaf and spine networks. Enabling sFlow telemetry on all the switches in the network provides centralized, real-time, visibility into network traffic.

The sFlow sampling mechanism implemented in the switches is a highly scaleable method of passively collecting traffic information. However, analyzing failed connections can be a challenge since very few packets are generated and the chance of sampling these packets is small. The traditional tools used to diagnose connectivity issues, ping and traceroute, are of limited value in a leaf and spine network since they only test a single path and are likely to miss the path that is experiencing difficulties.
An alternative method of addressing the multi-path tracing problem is to enable filtered packet capture on each switch, programming the filters to capture the packets of interest. However, this method can be slow and complex since every switch needs to be configured for each test and the switch configurations need to be cleared after the test has been completed.
This article explores how the hping3 tool can be used with sFlow to trace packet paths across the fabric and detect where they are being lost. The following Python script, trace.py, uses sFlow-RT's REST API to program a flow to watch for a specific flow and print the links that it traverses:
#!/usr/bin/env python
import argparse
import requests
import json
import signal
from random import randint

def sig_handler(signal,frame):
  requests.delete(rt+'/flow/'+name+'/json')
  exit(0)
signal.signal(signal.SIGINT, sig_handler)

parser = argparse.ArgumentParser()
parser.add_argument('filter', help='sFlow-RT flow filter, e.g. "ipsource=10.0.0.1"')
args = parser.parse_args()

rt = 'http://localhost:8008'
name = 'trace' + str(randint(0,10000))

flow = {'keys':'link:inputifindex','value':'frames',
        'filter':args.filter,'log':True,'flowStart':True}
requests.put(rt+'/flow/'+name+'/json',data=json.dumps(flow))

flowurl = rt+'/flows/json?maxFlows=100&timeout=60&name='+name
flowID = -1
while 1 == 1:
  r = requests.get(flowurl+'&flowID='+str(flowID))
  if r.status_code != 200: break
  flows = r.json()
  if len(flows) == 0: continue

  flowID = flows[0]["flowID"]
  flows.reverse()
  for f in flows:
    print f['flowKeys']
Note: See RESTflow for a description of the sFlow-RT REST API.First run the following Python script, supplying a filter to select the packets of interest:
./trace.py 'ipsource=172.16.134.1&udpsourceport=1111&ipdestination=172.16.135.1&udpdestinationport=53'Note: Identifying characteristics of failed connections may be inferable from application error logs. Otherwise, running packet capture on the affected host (tcpdump/wireshark) can identify the network attributes of interest.
Next, log into the host that is having connectivity problems and generate traffic matching the flow:
sudo hping3 -c 100000 -i u100 --udp -k -s 1111 -p 53 172.16.135.1Note: The above command sends 100,000 packets at a rate of 1 packet every 100 microseconds (i.e. at a rate of 10,000 packets per second). Select a packet rate that will not disturb production traffic on the network and make sure to send enough packets so that at least one packet will be sampled on each link. For example, for 10G links the packet sampling rate should be around 1-in-10,000 so generating 100,000 packets means that there is a 99.995% chance that a link carrying the flow will generate at least 1 sample (the probability is easily calculated using the Binomal distribution, see Wolfram Alpha).
The trace.py script will start printing links traversed by the flow immediately they are detected (typically in less than a second after starting the test):
./trace.py 'ipsource=172.16.134.1&udpsourceport=1111&ipdestination=172.16.135.1&udpdestinationport=53'
leaf1-spine2
leaf2-spine2
The above example traced the single path traversed by a specific connection. To explore all paths, drop the source port and hping3 will cycle through source ports and the traffic should be visible on all the equal cost paths (provided that a layer 4 hash function has been selected by the switches).
Drop the source port from the trace.py filter:
./trace.py 'ipsource=172.16.134.1&ipdestination=172.16.135.1&udpdestinationport=53'Drop the -k and -s options from the hping3 command:
sudo hping3 -c 100000 -i u100 --udp -p 53 172.16.138.1

Continuous network-wide monitoring of leaf and spine networks using sFlow leverages the capabilities of commodity switch hardware and provides centralized visibility that simplifies network operation and trouble shooting.
Saturday, September 17, 2016
Triggered remote packet capture using filtered ERSPAN

Traditional hierarchical network designs were relatively straightforward to monitor using a packet broker since traffic flowed through a small number of core switches and so a small number of taps provided network wide visibility. The move to leaf and spine fabric architectures eliminates the performance bottleneck of core switches to deliver low latency and high bandwidth connectivity to data center applications. However, traditional packet brokers are less attractive since spreading traffic across many links with equal cost multi-path (ECMP) routing means that many more links need to be monitored.
This article will explore how the remote Selective Spanning capability in Cumulus Linux 3.0 combined with industry standard sFlow telemetry embedded in commodity switch hardware provides a cost effective alternative to traditional packet brokers.
Cumulus Linux uses iptables rules to specify packet capture sessions. For example, the following rule forwards packets with source IP 20.0.1.0 and destination IP 20.0.1.2 to a packet analyzer on host 20.0.2.2:
-A FORWARD --in-interface swp+ -s 20.0.0.2 -d 20.0.1.2 -j ERSPAN --src-ip 90.0.0.1 --dst-ip 20.0.2.2REST API for Cumulus Linux ACLs describes a simple Python wrapper that exposes IP tables through a RESTful API. For example, the following command remotely installs the capture rule on switch 10.0.0.233:
curl -H "Content-Type:application/json" -X PUT --data \
  '["[iptables]","-A FORWARD --in-interface swp+ -s 20.0.0.2 -d 20.0.1.2 -j ERSPAN --src-ip 90.0.0.1 --dst-ip 20.0.2.2"]' \
  http://10.0.0.233:8080/acl/capture1
The following command deletes the rule:
curl -X DELETE http://10.0.0.233:8080/acl/capture1Selective Spanning makes it possible to turn every switch and port in the network into a capture device. However, it is import to carefully select which traffic to capture since the aggregate bandwidth of an ECMP fabric is measured in Terabits per second - far more traffic than can be handled by typical packet analyzers.

- Offload The capture network is a limited resource, both in terms of bandwidth and in the number of flows that can be simultaneously captured. Offloading as many tasks as possible to the sFlow analyzer frees up resources in the capture network, allowing the resources to be applied where they add most value. A good sFlow analyzer delivers data center wide visibility that can address many traffic accounting, capacity planning and traffic engineering use cases. In addition, many of the packet analysis tools (such as Wireshark) can accept sFlow data directly, further reducing the cases where a full capture is required.
- Context Data center wide monitoring using sFlow provides context for triggering packet capture. For example, sFlow monitoring might show an unusual packet size distribution for traffic to a particular service. Queries to the sFlow analyzer can identify the set of switches and ports involved in providing the service and identify a set of attributes that can be used to selectively capture the traffic.
- DDoS Certain classes of event such as DDoS flood attacks may be too large for the capture network to handle. DDoS mitigation with Cumulus Linux frees the capture network to focus on identifying more serious application layer attacks.
var wireshark = '10.0.0.70';
var idx=0;
function capture(localIP,remoteIP,agent) {
  var acl = [
    '[iptables]',
    '# emerging threat capture',
    '-A FORWARD --in-interface swp+ -s '+localIP+' -d '+remoteIP
    +' -j ERSPAN --src-ip '+agent+' --dst-ip '+wireshark,
    '-A FORWARD --in-interface swp+ -s '+remoteIP+' -d '+localIP
    +' -j ERSPAN --src-ip '+agent+' --dst-ip '+wireshark
  ];
  var id = 'emrg'+idx++;
  logWarning('capturing '+localIP+' rule '+id+' on '+agent);
  http('http://'+agent+':8080/acl/'+id,
        'PUT','application/json',JSON.stringify(acl));
}

var groups = {};
function loadGroup(name,url) {
  try {
    var res, cidrs = [], str = http(url);
    var reg = /^(\d{1,3}\.){3}\d{1,3}(\/\d{1,2})?$/mg;
    while((res = reg.exec(str)) != null) cidrs.push(res[0]);
    if(cidrs.length > 0) groups[name]=cidrs;
  } catch(e) {
    logWarning("failed to load " + url + ", " + e);
  }
}

loadGroup('compromised',
  'https://rules.emergingthreats.net/blockrules/compromised-ips.txt');
loadGroup('block',
  'https://rules.emergingthreats.net/fwrules/emerging-Block-IPs.txt');
setGroups('emerging',groups);

setFlow('emerging',
  {keys:'ipsource,ipdestination,group:ipdestination:emerging',value:'frames',
   log:true,flowStart:true});

setFlowHandler(function(rec) {
  var [localIP,remoteIP,group] = rec.flowKeys.split(',');
  try { capture(localIP,remoteIP,rec.agent); }
  catch(e) { logWarning("failed to capture " + e); }
});
Some comments about the script:
- The script uses sFlow telemetry to identify the potentially compromised host and the location (agent) observing the traffic.
- The location information is required so that the capture rule can be installed on a switch that is in the traffic path.
- The application has been simplified for clarity. In production, the blacklist information would be periodically updated and the capture sessions would be tracked so that they can be deleted when they they are no longer required.
- Writing Applications provides an introduction to sFlow-RT's API.
docker run -v "$PWD/emerging.js":/sflow-rt/emerging.js \
 -e "RTPROP=-Dscript.file=emerging.js" -p 6343:6343/udp sflow/sflow-rt
Note: Deploying analytics as a Docker service is a convenient method of packaging and running sFlow-RT. However, you can also download and install sFlow-RT as a package.
Once the software is running, you should see output similar to the following:
2016-09-17T22:19:16+0000 INFO: Listening, sFlow port 6343
2016-09-17T22:19:16+0000 INFO: Listening, HTTP port 8008
2016-09-17T22:19:16+0000 INFO: emerging.js started
2016-09-17T22:19:44+0000 WARNING: capturing 10.0.0.162 rule emrg0 on 10.0.0.253
The last line shows that traffic from host 10.0.0.162 to a blacklisted address has been detected and that selective spanning session has been configured on switch 10.0.0.253 to capture packets and send them to the host running Wireshark (10.0.0.70) for further analysis.
Tuesday, June 14, 2016
Merchant silicon based routing, flow analytics, and telemetry

The router market is poised to be similarly disrupted with the introduction of devices based on Broadcom's Jericho ASIC, which has the capacity to handle over 1 million routes in hardware (the full Internet routing table is currently around 600,000 routes).
An edge router is a very pricey box indeed, often costing anywhere from $100,000 to $200,000 per 100 Gb/sec port, depending on features in the router and not including optical cables that are also terribly expensive. Moreover, these routers might only be able to cram 80 ports into a half rack or full rack of space. The 7500R universal spine and 7280R universal leaf switches cost on the order of $3,000 per 100 Gb/sec port, and they are considerably denser and less expensive. - Leaving Fixed Function Switches Behind For Universal LeafsBroadcom Jericho ASICs are currently available in Arista 7500R/7280R routers and in Cisco NCS 5000 series routers. Expect further disruption to the router market when white box versions of the 1U router hardware enter the market.
There was general enthusiasm for Broadcom Jericho based routers in a recent discussion on the North American Network Operators' Group (NANOG) mailing list, Arista Routing Solutions, so merchant silicon based routers should be expected to sell well.The Broadcom Jericho ASICs also include hardware instrumentation to support industry standard sFlow traffic monitoring and streaming telemetry. For example, the following commands enable sFlow on all ports on an Arista router:
sflow source-interface Management1
sflow destination 170.1.1.11
sflow polling-interval 30
sflow sample 65535
sflow run
See EOS System Configuration Guide for details.
RP/0/RP0/CPU0:router#config
RP/0/RP0/CPU0:router(config)#flow exporter-map exp1
RP/0/RP0/CPU0:router(config-fem)#version v9
RP/0/RP0/CPU0:router(config-fem-ver)#options interface-table timeout 300
RP/0/RP0/CPU0:router(config-fem-ver)#options sampler-table timeout 300
RP/0/RP0/CPU0:router(config-fem-ver)#template data timeout 300
RP/0/RP0/CPU0:router(config-fem-ver)#template options timeout 300
RP/0/RP0/CPU0:router(config-fem-ver)#exit
RP/0/RP0/CPU0:router(config-fem)#transport udp 12515
RP/0/RP0/CPU0:router(config-fem)#source Loopback0
RP/0/RP0/CPU0:router(config-fem)#destination 170.1.1.11
RP/0/RP0/CPU0:router(config-fmm)#exit
RP/0/RP0/CPU0:router(config)#flow monitor-map MPLS-IPv6-fmm
RP/0/RP0/CPU0:router(config-fmm)#record mpls ipv6-fields labels 3
RP/0/RP0/CPU0:router(config-fmm)#exporter exp1
RP/0/RP0/CPU0:router(config-fmm)#cache entries 10000
RP/0/RP0/CPU0:router(config-fmm)#cache permanent
RP/0/RP0/CPU0:router(config-fmm)#exit
RP/0/RP0/CPU0:router(config)#sampler-map FSM
RP/0/RP0/CPU0:router(config-sm)#random 1 out-of 65535
RP/0/RP0/CPU0:router(config-sm)# exit
And further commands are needed to enable monitoring on each interface (and there can be a large number of interfaces given the high port density of these routers):
RP/0/RP0/CPU0:router(config)#interface HundredGigE 0/3/0/0
RP/0/RP0/CPU0:router(config-if)#flow mpls monitor MPLS-IPv6-fmm sampler FSM ingress
See Netflow Configuration Guide for Cisco NCS 5500 Series Routers, IOS XR Release 6.0.x for configuration details and limitations.
We are still not done, further steps are required to enable the equivalent to sFlow's streaming telemetry.
Create policy file defining the counters to export:
{
 "Name": "Test",
 "Metadata": {
  "Version": 25,
  "Description": "This is a sample policy",
  "Comment": "This is the first draft",
  "Identifier": "data that may be sent by the encoder to the mgmt stn"
 },
 "CollectionGroups": {
  "FirstGroup": {
  "Period": 30,
  "Paths": [
   "RootOper.InfraStatistics.Interface(*).Latest.GenericCounters"
   ]
  }
 }
}
Copy the policy file to router:$ scp Test.policy cisco@170.1.1.1:/telemetry/policiesFinally, configure the JSON encoder:
Router# configure
Router(config)#telemetry encoder json
Router(config-telemetry-json)#policy group FirstGroup
Router(config-policy-group)#policy Test
Router(config-policy-group)#destination ipv4 170.1.1.11 port 5555
Router(config-policy-group)#commit
See Cisco IOS XR Telemetry Configuration Guide for details.

Unlike the complex and disparate monitoring mechanisms in IOS XR, sFlow offers a simple, flexible and unified monitoring solution that exposes the full monitoring capabilities of the Broadcom Jericho ASIC. Expect a future release of IOS XR to add the sFlow support since sFlow a natural fit for the hardware capabilities of Jericho based router platforms and the addition of sFlow support will provide feature parity with Cisco's merchant silicon based switches.
Finally, the real-time visibility provided by sFlow supports a number of important use cases for high performance routers, including:
- DDoS mitigation
- Load balancing ECMP paths
- BGP route analytics
- Traffic engineering
- Usage based accounting
- Enforcing usage quotas
Wednesday, June 8, 2016
Docker networking with IPVLAN and Cumulus Linux

Eliminating the complexity associated with switching broadcast domains, VLANs, spanning tree, etc. allows a purely routed network to be easily scaled to very large sizes. However, there are some challenges to overcome:
IPVlan will require routes to be distributed to each endpoint. The driver only builds the Ipvlan L3 mode port and attaches the container to the interface. Route distribution throughout a cluster is beyond the initial implementation of this single host scoped driver. In L3 mode, the Docker host is very similar to a router starting new networks in the container. They are on networks that the upstream network will not know about without route distribution.Cumulus Networks has been working to simplify routing in the ECMP leaf and spine networks and the white paper Routing on the Host: An Introduction shows how the routing configuration used on Cumulus Linux can be extended to the hosts.
Update June 2, 2016: Routing on the Host contains packaged versions of the Cumulus Quagga daemon for Ubuntu, Redhat and Docker.


interface swp1
 ipv6 nd ra-interval 10
 link-detect
!
interface swp2
 ipv6 nd ra-interval 10
 link-detect
!
interface swp3
 ipv6 nd ra-interval 10
 link-detect
!
router bgp 65130
 bgp router-id 192.168.0.130
 bgp bestpath as-path multipath-relax
 neighbor EBGP peer-group
 neighbor EBGP remote-as external
 neighbor swp1 interface peer-group EBGP
 neighbor swp1 capability extended-nexthop
 neighbor swp2 interface peer-group EBGP
 neighbor swp2 capability extended-nexthop
 neighbor swp3 interface peer-group EBGP
 neighbor swp3 capability extended-nexthop
Auto-configured IPv6 link local addresses dramatically simplify the configuration of equal cost multi-path (ECMP) routing, eliminating the need to assign IP addresses and subnets to the routed switch ports. The simplified configuration is easy to template, all the switches have a very similar configuration, and an orchestration tool like Puppet, Chef, Ansible, Salt, etc. can be used to automate the process of configuring the switches.

Why the strange Ethernet interface names (e.g. enp0s3 instead of eth0)? They are the result of the predictable network interface names mechanism that is the default in Ubuntu 16.04. I can't say I am a fan, predictable interface names are difficult to read, push the problem of device naming up the stack, and make it difficult to write portable orchestration scripts.Quagga is used for BGP routing on the Cumulus Linux switches and on the Ubuntu hosts. The host BGP configurations are virtually identical to the switch configurations, but with an added redistribute stanza to automatically advertise locally attached addresses and subnets:
redistribute connected route-map IPVLANThe IPVLAN route-map is used to control the routes that are advertised, limiting them to the range of addresses that have been allocated to the IPVLAN orchestration system. Route filtering is an example of the flexibility that BGP brings as a routing protocol: top of rack switches can filter routes advertised by the hosts to protect the fabric from misconfigured hosts, and hosts can be configured to selectively advertise routes.
At this point, configuring routes between the hosts is easy. Configure a network on host1:
user@host1:~$ sudo ip address add 172.16.134.1/24 dev enp0s8And a route immediately appears on host2:
user@host2:~$ ip route
default via 10.0.0.254 dev enp0s3 onlink
10.0.0.0/24 dev enp0s3  proto kernel  scope link  src 10.0.0.135
172.16.134.0/24 via 169.254.0.1 dev enp0s8  proto zebra  metric 20 onlink
Add a network to host2:
user@host2:~$ sudo ip address add 172.16.135.1/24 dev enp0s8And it appears on host1:
cumulus@host1:~$ ip route
default via 10.0.0.254 dev enp0s3 onlink
10.0.0.0/24 dev enp0s3  proto kernel  scope link  src 10.0.0.134
172.16.134.0/24 dev enp0s8  proto kernel  scope link  src 172.16.134.1
172.16.135.0/24 via 169.254.0.1 dev enp0s8  proto zebra  metric 20 onlink
Connectivity across the leaf and spine fabric can be verified with a ping test:user@host2:~$ ping 172.16.134.1 PING 172.16.134.1 (172.16.134.1) 56(84) bytes of data. 64 bytes from 172.16.134.1: icmp_seq=1 ttl=61 time=2.60 ms 64 bytes from 172.16.134.1: icmp_seq=2 ttl=61 time=2.59 msUbuntu 16.04 was selected as the host operating system since it has built-in IPVLAN support. Docker Experimental Features distribution, which includes the IPVLAN Docker networking plugin, is installed on the two hosts.
The following command creates a Docker IPVLAN network on host1:
user@host1:~$ docker network create -d ipvlan --subnet=172.16.134.0/24 \
-o parent=enp0s8 -o ipvlan_mode=l3 ipv3
Note: Route(s) to the IPVLAN network would be automatically distributed if the above command had an option to attach the subnets to the parent interface.
The following commands start a container attached to the network and show the network settings as seen by the container:
user@host1:~$ docker run --net=ipv3 -it --rm alpine /bin/sh
/ # ifconfig
eth0      Link encap:Ethernet  HWaddr 08:00:27:70:FA:B5
          inet addr:172.16.134.2  Bcast:0.0.0.0  Mask:255.255.255.0
          inet6 addr: fe80::a00:27ff:fe70:fab5%32582/64 Scope:Link
          UP BROADCAST RUNNING NOARP MULTICAST  MTU:1500  Metric:1
          RX packets:0 errors:0 dropped:0 overruns:0 frame:0
          TX packets:0 errors:0 dropped:2 overruns:0 carrier:0
          collisions:0 txqueuelen:0
          RX bytes:0 (0.0 B)  TX bytes:0 (0.0 B)

lo        Link encap:Local Loopback
          inet addr:127.0.0.1  Mask:255.0.0.0
          inet6 addr: ::1%32582/128 Scope:Host
          UP LOOPBACK RUNNING  MTU:65536  Metric:1
          RX packets:0 errors:0 dropped:0 overruns:0 frame:0
          TX packets:0 errors:0 dropped:0 overruns:0 carrier:0
          collisions:0 txqueuelen:1
          RX bytes:0 (0.0 B)  TX bytes:0 (0.0 B)

/ # ip route
default dev eth0
172.16.134.0/24 dev eth0  src 172.16.134.2
Connectivity between containers attached to the same IPVLAN can be verified by starting a second container and performing a ping test:
user@host1:~$ docker run --net=ipv3 -it --rm alpine /bin/sh
/ # ping 172.16.134.2
PING 172.16.134.2 (172.16.134.2): 56 data bytes
64 bytes from 172.16.134.2: seq=0 ttl=64 time=0.085 ms
64 bytes from 172.16.134.2: seq=1 ttl=64 time=0.077 ms
Unfortunately, connecting containers to the IPVLAN network interferes with the auto-configured IPv6 link local BGP connection between host1 and leaf1, which results in host1 being disconnected from the leaf and spine fabric, and losing connectivity to host2. Assigning static IPv4 addresses to leaf1 and host1 complicates the configuration but solves the problem. For example, here is the Quagga BGP configuration on host1:
router bgp 65134
 bgp router-id 192.168.0.134
 redistribute connected route-map NON-MGMT
 neighbor 192.168.1.130 remote-as 65130
Now it is possible to connect to the containers remotely from host2:
user@host2:~$ ping 172.16.134.2
PING 172.16.134.2 (172.16.134.2) 56(84) bytes of data.
64 bytes from 172.16.134.2: icmp_seq=1 ttl=61 time=2.72 ms
64 bytes from 172.16.134.2: icmp_seq=2 ttl=61 time=2.79 ms
Now that we have end to end connectivity, how can we monitor traffic?

The sFlow-RT real-time analytics software can be installed on a host, or spun up in a container using a simple Dockerfile:
FROM   centos:centos6
RUN    yum install -y wget
RUN    yum install -y java-1.7.0-openjdk
RUN    wget http://www.inmon.com/products/sFlow-RT/sflow-rt.tar.gz
RUN    tar -xzf sflow-rt.tar.gz
EXPOSE 8008 6343/udp
CMD    ./sflow-rt/start.sh
Update July 22, 2016: sFlow-RT can now be run from Docker Hub, see sflow/sflow-rt for instructions.
Writing Applications provides an overview of sFlow-RT's REST API. The following Python script demonstrates end to end visibililty by reporting the specific path that a large "Elephant" flow takes across the leaf and spine fabric:
#!/usr/bin/env python
import requests
import json

rt = 'http://127.0.0.1:8008'

flow = {'keys':'node:inputifindex,ipsource,ipdestination,ipttl','value':'bytes'}
requests.put(rt+'/flow/elephant/json',data=json.dumps(flow))

threshold = {'metric':'elephant','value':100000000/8,'byFlow':True,'timeout':600}
requests.put(rt+'/threshold/elephant/json',data=json.dumps(threshold))

eventurl = rt+'/events/json?thresholdID=elephant&maxEvents=10&timeout=60'
eventID = -1
while 1 == 1:
  r = requests.get(eventurl + "&eventID=" + str(eventID))
  if r.status_code != 200: break
  events = r.json()
  if len(events) == 0: continue

  eventID = events[0]["eventID"]
  events.reverse()
  for e in events:
    print e['flowKey']
Running the script and generating a large flow from host1 (172.16.135.1) to an IPVLAN connected container on host2 (172.16.134.2) gives the following output:$ ./elephant.py spine2,172.16.135.1,172.16.134.2,62 leaf1,172.16.135.1,172.16.134.2,61 host2,172.16.135.1,172.16.134.2,64 leaf2,172.16.135.1,172.16.134.2,63 host1,172.16.135.1,172.16.134.2,61The last field is the IP TTL (time to live). Ordering the events by TTL shows the path across the network (since the TTL is decremented by each switch along the path):
host2 -> leaf2 -> spine2 -> leaf1 -> host1
Monitoring resources on the physical switches is critical to large scale IPVLAN deployments since the number of routes must be kept within the table sizes supported by the hardware. Broadcom ASIC table utilization metrics, DevOps, and SDN describes how sFlow exports hardware routing table metrics.
The use of Cumulus Linux greatly simplified the configuration of the ECMP fabric and allowed a common set of routing, monitoring, and orchestration software to be used for both hosts and switches. A common set of tools dramatically simplifies the task of configuring, testing, and managing end to end Docker networking.
Finally, end to end IP routing using the new Docker IPVLAN networking plugin is very promising. Eliminating overlays and bridging improves scaleability, reduces operational complexity, and facilitates automation using a mature routing control plane (BGP).
Thursday, June 2, 2016
OVS Orbit podcast with Ben Pfaff

Follow the link to see listen to the podcast, read the extensive show notes, follow related links, and to subscribe to the podcast.
Wednesday, May 18, 2016
Identifying bad ECMP paths
Processing active test data can detect that packets are being lost within approximately 20 seconds, but doesn't provide the precise location where packets are dropped. A custom multi-path traceroute tool (fbtracert) is used to follow up and narrow down the location of the packet loss.
While described as measuring packet loss, the test system is really measuring path loss. For example, if there are 64 ECMP paths in a pod, then the loss of one path would result in a packet loss of approximately 1 in 64 packets in traffic flows that cross the ECMP group.
Black hole detection describes an alternative approach. Industry standard sFlow instrumentation embedded within most vendor's switch hardware provides visibility into the paths that packets take across the network - see Packet paths. In some ways the sFlow telemetry is very similar to the traceroute tests, each measurement identifies the specific location a packet was seen.
The passive sFlow monitoring approach has significant benefits:
- Eliminates active test traffic since production traffic exercises network paths.
- Eliminates traffic generators and test targets required to perform the active tests.
- Simplifies analysis since sFlow measurements provides a direct indication of anomaly location.
- Reduced operation complexity and associated costs.
Tuesday, May 17, 2016
Black hole detection

The white paper discusses how Broadcom ASICs can be programmed to detect blackholes based on packet paths, i.e. packets arriving at a ToR switch from a Spine switch should never be forwarded to another Spine switch.
This article will discuss how the industry standard sFlow instrumentation (also included in Broadcom based switches) can be used to provide fabric wide detection of black holes.

The same open source Host sFlow agent is running on the Linux servers and switches, streaming real-time telemetry over the out of band management network to sFlow analysis software running on the management server.

The Fabric View application needs two pieces of configuration information: the network topology and the address allocation.
Topology discovery with Cumulus Linux describes how to extract the topology in a Cumulus Linux network, yielding the following topology.json file:
{
  "links": {
    "leaf2-spine2": {
      "node1": "leaf2", "port1": "swp2",
      "node2": "spine2", "port2": "swp2"
    },
    "leaf1-spine1": {
      "node1": "leaf1", "port1": "swp1",
      "node2": "spine1", "port2": "swp1"
    },
    "leaf1-spine2": {
      "node1": "leaf1", "port1": "swp2",
      "node2": "spine2", "port2": "swp1"
    },
    "leaf2-spine1": {
      "node1": "leaf2", "port1": "swp1",
      "node2": "spine1", "port2": "swp2"
    }
  }
}
And the following groups.json file lists the /24 address blocks allocated to hosts connected to each leaf switch:{
"external":["0.0.0.0/0"],
"rack1":["192.168.1.0/24"],
"rack2":["192.168.2.0/24"]
}
Defining Flows describes how sFlow-RT can be programmed to perform flow analytics. The following JavaScript file implements the blackhole detection and can be installed in the sflow-rt/app/fabric-view/scripts/ directory:// track flows that are sent back to spine
var pathfilt = 'node:inputifindex~leaf.*';
pathfilt += '&link:inputifindex!=null';
pathfilt += '&link:outputifindex!=null';
setFlow('fv-blackhole-path',
{keys:'group:ipdestination:fv',value:'frames', filter:pathfilt,
log:true, flowStart:true}
);
// track locally originating flows that have TTL indicating non shortest path
var diam = 2;
var ttlfilt = 'range:ipttl:0:'+(64-diam-2)+'=true';
ttlfilt += '&group:ipsource:fv!=external';
setFlow('fv-blackhole-ttl',
{keys:'group:ipdestination:fv,ipttl', value:'frames', filter:ttlfilt,
log:true, flowStart:true}
);
setFlowHandler(function(rec) {
var parts, msg = {'type':'blackhole'};
switch(rec.name) {
case 'fv-blackhole-path':
msg.rack = rec.flowKeys;
break;
case 'fv-blackhole-ttl':
var [rack,ttl] = rec.flowKeys.split(',');
msg.rack = rack;
msg.ttl = ttl;
break;
}
var port = topologyInterfaceToPort(rec.agent,rec.dataSource);
if(port && port.node) msg.node = port.node;
logWarning(JSON.stringify(msg));
},['fv-blackhole-path','fv-blackhole-ttl']);
Some notes on the script:
- The fv-blackhole-path flow definition has a filter that matches packets that arrive on an inter switch link and are sent back on another link (the rule described in the Broadcom paper.)
- The fv-blackhole-ttl script relies on the fact that the servers are running Linux which uses an initial TTL of 64. Since it only takes 3 routing hops to traverse the leaf-spine fabric, any TTL values of 60 or smaller are an indication of a potential routing loop and black hole.
- Flow records are generated as soon as a match is found and the setFlowHandler() function is uses to process the records, in this case logging warning messages.
$ ./start.sh
2016-05-17T19:47:37-0700 INFO: Listening, sFlow port 9343
2016-05-17T19:47:38-0700 INFO: Starting the Jetty [HTTP/1.1] server on port 8008
2016-05-17T19:47:38-0700 INFO: Starting com.sflow.rt.rest.SFlowApplication application
2016-05-17T19:47:38-0700 INFO: Listening, http://localhost:8008
2016-05-17T19:47:38-0700 INFO: app/fabric-view/scripts/fabric-view-stats.js started
2016-05-17T19:47:38-0700 INFO: app/fabric-view/scripts/blackhole.js started
2016-05-17T19:47:38-0700 INFO: app/fabric-view/scripts/fabric-view.js started
2016-05-17T19:47:38-0700 INFO: app/fabric-view/scripts/fabric-view-elephants.js started
2016-05-17T19:47:38-0700 INFO: app/fabric-view/scripts/fabric-view-usr.js started
2016-05-17T20:50:33-0700 WARNING: {"type":"blackhole","rack":"rack2","ttl":"13","node":"leaf2"}
2016-05-17T20:50:48-0700 WARNING: {"type":"blackhole","rack":"rack2","node":"leaf2"}
Exporting events using syslog describes how to send events to SIEM tools like Logstash or Splunk so that they can be queried. The script can also be extended to perform further analysis, or to automatically apply remediation controls.Thursday, January 21, 2016
Podcast with Nick Buraglio and Brent Salisbury

Non-Blocking #1: SFlow With Peter Phaal Of InMon And SFlow.Org is a discussion between Brent Salisbury (networkstatic.net), Nick Buraglio (forwardingplane.net), and Peter Phaal (blog.sflow.com).
Web sites and tools mentioned in the podcast:
- sFlow.org
- Devices that support sFlow
- Software to analyze sFlow
- sFlow.org mailing list
- sFlow structures
- blog.sflow.com (incorrectly referenced as blog.sflow.org in the podcast)
- Host sFlow
- sflowtool
The podcast touches on a number of topics that have been explored in greater detail on this blog. The topics are listed in roughly the order they are mentioned in the podcast:
- Widespread support for sFlow among switch vendors
- Disaggregated flow cache
- ULOG
- Push vs Pull
- sFlow vs SNMP for interface counters
- Broadcom ASIC table utilization metrics, DevOps, and SDN
- Broadcom BroadView Instrumentation
- Rapidly detecting large flows, sFlow vs. NetFlow/IPFIX
- SDN and large flows
- Probes
- Packet headers
- Network virtualization visibility demo
- History of sFlow
- Standards
- Open vSwitch performance monitoring
- Wireless
- Prescriptive vs descriptive standards (sFlow / IPFIX)
- RMON (4 groups)
- Observability
- Host sFlow distributed agent
- Host sFlow data model
- Multi-tenant traffic in virtualized network environments
- Workload placement
- SDN router using merchant silicon top of rack switch
- White box Internet router PoC
- Active Route Manager
- Leaf and spine traffic engineering using segment routing and SDN
- CORD: Open-source spine-leaf Fabric (demo from 2015 Open Networking Summit)
- sflowtool
- sflowtool for packet caputure
- sflowtool with Wireshark
Friday, November 20, 2015
Open vSwitch 2015 Fall Conference
The recent Open vSwitch 2015 Fall Conference agenda included a wide variety speakers addressing a range of topics, including: Open Network Virtualization (OVN), containers, service chaining, and network function virtualization (NFV).
The video above is a recording of the following sFlow related talk from the conference:
New OVS instrumentation features aimed at real-time monitoring of virtual networks (Peter Phaal, InMon)This talk is a follow up to an Open vSwitch 2014 Fall Conference talk on the role of monitoring in building feedback control systems.
The talk will describe the recently added packet-sampling mechanism that returns the full list of OVS actions from the kernel. A demonstration will show how the OVS sFlow agent uses this mechanism to provide real-time tunnel visibility. The motivation for this visibility will be discussed, using examples such as end-to-end troubleshooting across physical and virtual networks, and tuning network packet paths by influencing workload placement in a VM/Container environment.
Slides and videos for all the conference talks are available on the Open vSwitch web site.
Wednesday, November 18, 2015
Network virtualization visibility demo

The diagram above shows the demonstration testbed. It consists of a leaf and spine network connecting two hosts, each of which is running a pair of Docker containers connected to Open vSwitch (OVS). The vSwitches are controlled by Open Virtual Network (OVN), which has been configured to create two logical switches, the first connecting the left most containers on each host and the second connecting the right most containers. The testbed is described in more detail in Open Virtual Network (OVN) and is built from free components and can easily be replicated.
The dashboard in the video illustrates the end to end visibility that is possible by combining standard sFlow instrumentation in the physical switches with sFlow instrumentation in Open vSwitch and Host sFlow agents on the servers.
The diagram on the left of the dashboard shows a logical map of the elements in the testbed. The top panel shows the two logical switches created in OVN, sw1 connecting the left containers and sw0 connecting the right containers. The dotted lines represent the logical switches ports and their width shows the current traffic rate flowing over the logical link.
The solid lines below show the path that the virtual network traffic actually takes. From a container on Server1 to the virtual switch (OVS), where it is encapsulated in a Geneve tunnel and sent via leaf1, spine1, and leaf2 to the OVS instance on Server2, which decapsulates the traffic and delivers it to the other container on the logical switch.
Both logical networks share the same physical network and this is shown be link color. Traffic associated with sw1 is shown as red, traffic associated with sw0 is shown as blue, and a mixture of sw1 and sw0 traffic is shown as magenta.
The physical network is a shared resource for the virtual networks that make use of it. Understanding how this resource is being utilized is essential to ensure that virtual networks do not interfere with each other, for example, one tenant backing up data over their virtual network may cause unacceptable response time problems for another tenant.
The strip charts to the right of the diagram show representative examples of the data that is available and demonstrate comprehensive visibility into, and across, layers in the virtualization stack. Going from top to bottom:
- Container CPU Utilization The trend chart shows the per container CPU load for the containers. This data comes from the Host sFlow agents.
- Container Traffic This trend chart merges sFlow data from the Host sFlow and Open vSwitch to show traffic flowing between containers.
- OVN Virtual Switch Traffic This trend chart merges data from the OVN Northbound interface (specifically, logical port MAC addresses and logical switch names) and Open vSwitch to show traffic flowing through each logical switch.
- Open vSwitch Performance This trend chart shows key performance indicators based on metrics exported by the Open vSwitches, see Open vSwitch performance monitoring.
- Leaf/Spine Traffic This chart combines data from all the switches in the leaf / spine network to show traffic flows. The chart demonstrates that sFlow from the physical network devices provides visibility into the outer (tunnel) addresses and inner (tenant/virtual network) addresses, see Tunnels.
The demonstration is available on GitHub. The following steps will download the demo and provide data that can be used to explore the sFlow-RT APIs described in Open Virtual Network (OVN) that were used to construct this dashboard.
wget http://www.inmon.com/products/sFlow-RT/sflow-rt.tar.gz
tar -xvzf sflow-rt.tar.gz
cd sflow-rt
./get-app.sh pphaal ovs-2015
Edit the start.sh file to playback the included captured sFlow data:
#!/bin/sh

HOME=`dirname $0`
cd $HOME

JAR="./lib/sflowrt.jar"
JVM_OPTS="-Xincgc -Xmx200m"
RT_OPTS="-Dsflow.port=6343 -Dhttp.port=8008 -Dsflow.file=app/ovs-2015/demo.pcap"
SCRIPTS="-Dscript.file=init.js"

exec java ${JVM_OPTS} ${RT_OPTS} ${SCRIPTS} -jar ${JAR}
Start sFlow-RT:
[user@server sflow-rt]$ ./start.sh
2015-11-18T13:22:14-0800 INFO: Reading PCAP file, app/ovs-2015/demo.pcap
2015-11-18T13:22:15-0800 INFO: Starting the Jetty [HTTP/1.1] server on port 8008
2015-11-18T13:22:15-0800 INFO: Starting com.sflow.rt.rest.SFlowApplication application
2015-11-18T13:22:15-0800 INFO: Listening, http://localhost:8008
2015-11-18T13:22:15-0800 INFO: init.js started
2015-11-18T13:22:15-0800 INFO: app/ovs-2015/scripts/status.js started
2015-11-18T13:22:16-0800 INFO: init.js stopped
Finally, access the web interface http://server:8008/app/ovs-2015/html/ and you should see the screen shown in the video.
The sFlow monitoring technology scales to large production networks. The instrumentation is built into physical switch hardware and is available in 1G/10G/25G/40G/50G/100G data center switches from most vendors (see sFlow.org). The sFlow instrumentation in Open vSwitch is built into the Linux kernel and is an extremely efficient method of monitoring large numbers of virtual machines and/or containers.
The demonstration dashboard illustrates the type of operational visibility that can be delivered using sFlow. However, for large scale deployments, sFlow data can be incorporated into existing DevOps tool sets to augment data that is already being collected.

Subscribe to:
Posts (Atom)