The GitHub
sflow-rt/containerlab project contains example network topologies for the
Containerlab network emulation tool that demonstrate real-time streaming telemetry in realistic data center topologies and network configurations. The examples use the same
FRRouting (FRR) engine that is part of
SONiC,
NVIDIA Cumulus Linux, and
DENT network operating systems. Containerlab can be used to experiment before deploying solutions into production. Examples include: tracing ECMP flows in leaf and spine topologies, EVPN visibility, and automated DDoS mitigation using BGP Flowspec and RTBH controls.
Raspberry Pi 5 real-time network analytics describes how to install Docker on a Raspberry Pi 5.
docker run hello-world
Run the
hello-world container to verify that Docker in properly installed and running before proceeding.
git clone https://github.com/sflow-rt/containerlab.git
Download the
sflow-rt/containerlab project from GitHub.
cd containerlab
./run-clab
Start Containerlab.
containerlab deploy -t clos5.yml
Start the 5 stage leaf and spine topology shown at the top of this page. The initial launch may take a couple of minutes as the container images are downloaded for the first time. Once the images are downloaded, the topology deploys in around 10 seconds.
./topo.py clab-clos5
Push the topology to the sFlow-RT analytics software.
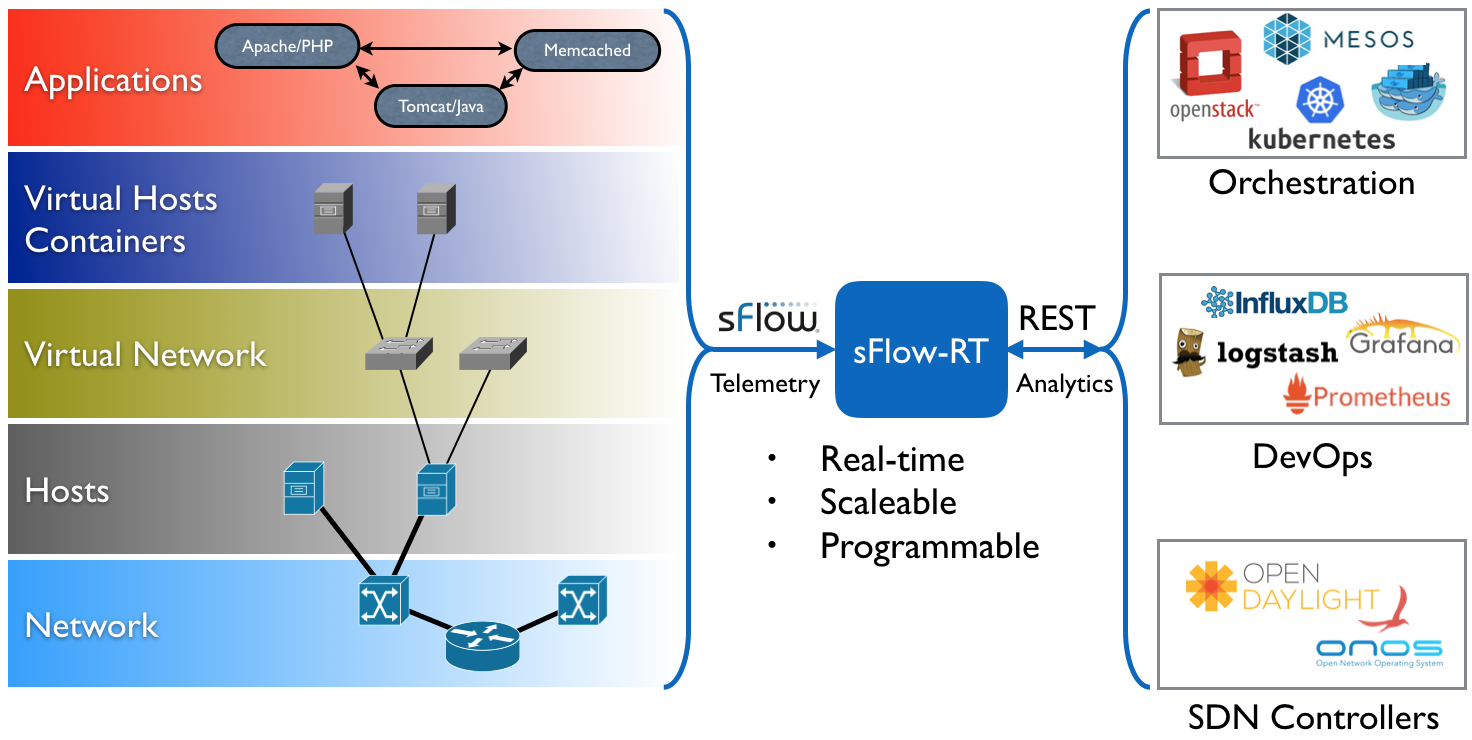
An instance of the
sFlow-RT real-time analytics engine receives industry standard
sFlow telemetry from all the switches in the network. All of the switches in the topology are configured to send sFlow to the sFlow-RT instance. In this case, Containerlab is running the pre-built
sflow/clab-sflow-rt image which packages sFlow-RT with useful applications for exploring the data.
Connect to the web interface on port 8008. The sFlow-RT dashboard verifies that telemetry is being received from 10 agents (the 10 switches in the Clos fabric). See the
sFlow-RT Quickstart guide for more information.
The
Containerlab Dashboard (click on sFlow-RT
Apps tab and
containerlab-dashboard button) shows real-time dashboard displaying up to the second traffic.
docker exec -it clab-clos5-h1 iperf3 -c 172.16.4.2
Each of the hosts in the network has an
iperf3 server, so running the above command will test bandwidth between h1 and h4.
docker exec -it clab-clos5-h1 iperf3 -c 2001:172:16:4::2
Generate a large IPv6 flow between
h1 and
h4. The traffic flows should immediately appear in the
Top Flows chart. You can check the accuracy by comparing the values reported by
iperf3 with those shown in the chart.
Click on the
Topology tab to see a real-time weathermap of traffic flowing over the topology. See how repeated iperf3 tests take different ECMP (equal-cost multi-path) routes across the network.
docker exec -it clab-clos5-leaf1 vtysh
Linux with open source routing software (FRRouting) is an accessible alternative to vendor routing stacks (no registration / license required, no restriction on copying means you can share images on Docker Hub, no need for virtual machines). FRRouting is popular in production network operating systems (e.g. Cumulus Linux, SONiC, DENT, etc.) and the
VTY shell provides an industry standard CLI for configuration, so labs built around FRR allow realistic network configurations to be explored.
docker exec -it clab-clos5-leaf1 vtysh -c "show running-config"
Use
vtysh to show the running configuration on
leaf1.
containerlab destroy -t clos5.yml
When you are finished, run the above command to stop the containers and free the resources associated with the emulation. Try out
other topologies from the project to explore topics such as DDoS mitigation, BGP Flowspec, and EVPN.
Note: If you are building your own topologies, the Raspberry Pi 5 8G can comfortably handle topologies with up to 50 FRR/Alpine Linux nodes.
Getting Started provides an introduction to sFlow-RT analytics and APIs. Containerlab provides a useful environment for developing and testing monitoring applications for sFlow-RT before moving them into production.
Moving monitoring solutions from Containerlab to production is straightforward since sFlow is widely implemented in datacenter equipment from vendors including: A10, Arista, Aruba, Cisco, Edge-Core, Extreme, Huawei, Juniper, NEC, Netgear, Nokia, NVIDIA, Quanta, and ZTE. In addition, the open source Host sFlow agent makes it easy to extend visibility beyond the physical network into the compute infrastructure.
Raspberry Pi 5 real-time network analytics describes how to deploy an sFlow-RT, Prometheus, and Grafana monitoring stack to monitor live network traffic.