Thursday, December 1, 2022

IPv6 flow analytics with Containerlab

CONTAINERlab is a Docker orchestration tool for creating virtual network topologies. The sflow-rt/containerlab project contains a number of topologies demonstrating industry standard streaming sFlow telemetry with realistic data center topologies. This article extends the examples in Real-time telemetry from a 5 stage Clos fabric and Real-time EVPN fabric visibility to demonstrate visibility into IPv6 traffic flows.

docker run --rm -it --privileged --network host --pid="host" \
  -v /var/run/docker.sock:/var/run/docker.sock -v /run/netns:/run/netns \
  -v $(pwd):$(pwd) -w $(pwd) \
  ghcr.io/srl-labs/clab bash

Run the above command to start Containerlab if you already have Docker installed. Otherwise, Installation provides detailed instructions for a variety of platforms.

curl -O https://raw.githubusercontent.com/sflow-rt/containerlab/master/clos5.yml

Download the topology file for the 5 stage Clos fabric shown above.

containerlab deploy -t clos5.yml

Finally, deploy the topology.

The screen capture shows a real-time view of traffic flowing across the network during an iperf3 test. Click on the sFlow-RT Apps menu and select the browse-flows application, or click here for a direct link to a chart with the settings shown above.
docker exec -it clab-clos5-h1 iperf3 -c 2001:172:16:4::2

Each of the hosts in the network has an iperf3 server, so running the above command will test bandwidth between h1 and h4.

containerlab destroy -t clos5.yml

When you are finished, run the above command to stop the containers and free the resources associated with the emulation.

Real-time EVPN fabric visibility describes the EVPN configuration above in detail. The following steps extend the example to demonstrate visibility into IPv6 flows.
curl -O https://raw.githubusercontent.com/sflow-rt/containerlab/master/evpn3.yml
Download the topology file.
The screen capture shows a real-time view of traffic flowing across the network during an iperf3 test. Connect to the sFlow-RT Flow Browser application, or click here for a direct link to a chart with the settings shown above.
docker exec -it clab-evpn3-h1 iperf3 -c 2001:172:16:10::2

Each of the hosts in the network has an iperf3 server, so running the above command will test bandwidth between h1 and h2. The flow should immediately appear in the Flow Browser chart.

containerlab destroy -t evpn3.yml

When you are finished, run the above command to stop the containers and free the resources associated with the emulation.

The following articles describe additionial examples based on sflow-rt/containerlab topologies:

Moving the monitoring solution from Containerlab to production is straightforward since sFlow is widely implemented in datacenter equipment from vendors including: A10, Arista, Aruba, Cisco, Edge-Core, Extreme, Huawei, Juniper, NEC, Netgear, Nokia, NVIDIA, Quanta, and ZTE. In addition, the open source Host sFlow agent makes it easy to extend visibility beyond the physical network into the compute infrastructure.

Thursday, November 17, 2022

SC22 SCinet network monitoring

The data shown in the chart was gathered from The International Conference for High Performance Computing, Networking, Storage, and Analysis (SC22) being held this week in Dallas. The conference network, SCinet, is described as the fastest and most powerful network on Earth, connecting the SC community to the world. The chart provides an up to the second view of overall SCinet traffic, the lower chart showing total traffic hitting a sustained 8Tbps.
The poster shows the topology of the SCinet network. Monitoring flow data from 5,852 switch/router ports with 162Tbps total bandwith with sub-second latency is required to construct the charts.
The chart was generated using industry standard streaming sFlow telemetry from switches and routers in the SCinet network. An instance of the sFlow-RT real-time analytics engine computes the flow metrics shown in the charts.
Most of the load was due to large 400Gbit/s, 200Gbit/s and 100Gbit/s flows that were part of the Network Research Exhibition. The chart above shows that 10 large flows are responsible for 1.5Tbps of traffic.
Scientific network tags (scitags) describes how IPv6 flowlabels allow network flow analytics to identify network traffic associated with bulk scientific data transfers.
RDMA network visibility shows how bulk data transfers using Remote Direct Memory Access (RDMA).

Wednesday, November 16, 2022

RDMA network visibility

The Remote Direct Memory Access (RDMA) data shown in the chart was gathered from The International Conference for High Performance Computing, Networking, Storage, and Analysis (SC22) being held this week in Dallas. The conference network, SCinet, is described as the fastest and most powerful network on Earth, connecting the SC community to the world.
Resilient Distributed Processing and Reconfigurable Networks is one of the demonstrations using SCinet - Location: Booth 2847 (StarLight). Planned SC22 focus is on RDMA enabled data movement and dynamic network control.
  1. RDMA Tbps performance over global distance for timely Terabyte bulk data transfers (goal << 1 min Tbyte transfer on N by 400G network).
  2. Dynamic shifting of processing and network resources from on location/path/system to another (in response to demand and availability).
The real-time chart at the top of this page shows an up to the second view of RDMA traffic (broken out by source, destination, and RDMA operation).
The chart was generated using industry standard streaming sFlow telemetry from switches and routers in the SCinet network. An instance of the sFlow-RT analytics engine computes the RDMA flow metrics shown in the chart. RESTflow describes how sFlow disaggregates the traditional NetFlow / IPFIX analytics pipeline to offer flexible, scaleable, low latency flow measurements. Flow metrics with Prometheus and Grafana describes how metrics can be stored in a time series database for use in operational dashboards.

Real-time traffic analytics transforms network monitoring from reporting on the past to observing and acting on the present to automate troubleshooting and traffic engineering, e.g. Leaf and spine traffic engineering using segment routing and SDN and DDoS protection quickstart guide.

Tuesday, November 15, 2022

Scientific network tags (scitags)

The data shown in the chart was gathered from The International Conference for High Performance Computing, Networking, Storage, and Analysis (SC22) being held this week in Dallas. The conference network, SCinet, is described as the fastest and most powerful network on Earth, connecting the SC community to the world. The chart shows data generated as part of the Packet Marking for Networked Scientific Workflows demonstration using SCinet - Booth 2847 (StarLight).

Scientific network tags (scitags) is an initiative promoting identification of the science domains and their high-level activities at the network level. Participants include, dCacheESnet, GÉANT, Internet2, Jisc, NORDUnet, OFTS, OSG, RNP, RUCIO, StarLight, XRootD.

This article will demonstrate how industry standard sFlow telemetry streaming from switches and routers can be used to report on science domain activity in real-time using the sFlow-RT analytics engine.

The scitags initiative makes use of the IPv6 packet header to mark traffic. Experiment and activity identifiers are encoded in the IPv6 Flow label field. Identifiers are published in an online registry in the form of a JSON document, https://www.scitags.org/api.json.

One might expect IPFIX / NetFlow to be a possible alternative to sFlow for scitags reporting, but with NetFlow/IPFIX the network devices summarize the traffic before exporting flow records containing only the fields they decode in the firmware, and currently leading vendors such as Arista, Cisco and Juniper do not include the IPv6 flow label as a field that can be exported. A firmware/hardware update would be needed to access the data.  And the same roadblock may repeat for cases where the IPv6 is carried over a new tunnel encapsulation, or for any other new field that may be requested.

On the other hand, the sFlow protocol disaggregates the flow analytics pipeline, devices stream raw packet headers and metadata in real-time to an external analyzer which decodes the packets and builds flow records - see RESTflow for more information. This means that visibility into scitags traffic is available today from every sFlow capable device released over the last 20 years with no vendor involvement - the only  requirement is an sFlow collector that decodes IPv6 packet headers. Vendors supporting sFlow include: A10, Arista, Aruba, Cisco, Edge-Core, Extreme, Huawei, Juniper, NEC, NVIDIA, Netgear, Nokia, Quanta, and ZTE.

Finally, real-time visibility is a key benefit of using sFlow. The IPFIX / NetFlow flow cache on the router adds significant delay to measurements (anything from 30 seconds to 30 minutes for long lived science flows based on the active timeout setting). With sFlow, data is immediately exported by the router, allowing the sFlow analyzer to present an up to the second view of traffic. Real-time traffic analytics transforms network monitoring from reporting on the past to observing and acting on the present to automate troubleshooting and traffic engineering, e.g. Leaf and spine traffic engineering using segment routing and SDN and DDoS protection quickstart guide.

function reverseBits(val,n) {
  var bits = val.toString(2).padStart(n, '0');
  var reversed = bits.split('').reverse().join('');
  return parseInt(reversed,2);
}

function flowlabel(expId,activityId) {
  return (reverseBits(expId,9) << 9) + (activityId << 2);
}

function updateMap() {
  var tags, parsed;
  try {
    tags = http('https://www.scitags.org/api.json');
    parsed = JSON.parse(tags);
  } catch(e) {
    logWarning('SCITAGS http get failed ' + e);
    return;
  }
  var experiments = parsed && parsed.experiments;
  if(!experiments) return;
  var map = {};
  experiments.forEach(function(experiment) {
    var expName = experiment.expName;
    var expId = experiment.expId;
    var activities = experiment.activities;
    activities.forEach(function(activity) {
      var activityName = activity.activityName;
      var activityId = activity.activityId;
      var key = (expName + '.' + activityName).replace(/ /g,"_");
      map[key] = [ flowlabel(expId,activityId) ];
    });
  });

  setMap('scitag',map);
}

updateMap();
setIntervalHandler(updateMap,600);

The above scitags.js script periodically queries the registry and creates an sFlow-RT map from flow label to registry entry. See Writing Applications for more information on the script.

docker run --rm -v $PWD/scitags.js:/sflow-rt/scitags.js \
-p 8008:8008 -p 6343:6343/udp sflow/prometheus -Dscript.file=scitags.js

Use the above command to run sFlow-RT with the scitags.js using the pre-built sflow/prometheus image.

map:[bits:ip6flowlabel:261884]:scitag

Defining Flows describes how program sFlow-RT's flow analytics engine. The example above shows how to use the bits: function to mask out the Entropy bits from the ip6flowlabel and extract the Activity and Experiment bits (00111111111011111100 binary is 261884 in decimal). The masked value is used as a key in the scitag map built by the scitags.js script.

The Browse Flows trend above shows a network traffic flow identified by its scitag value.

iperf3 -c 2001:172:16:2::2 --flowlabel 65572

The ESnet iperf3 tool was used to generate the IPv6 traffic with configured flowlabel shown in the chart.

Flow metrics with Prometheus and Grafana describes how to export flow analytics to a time series database for use in operational dashboards.

  - job_name: 'sflow-rt-scitag-bps'
    metrics_path: /app/prometheus/scripts/export.js/flows/ALL/txt
    static_configs:
      - targets: ['127.0.0.1:8008']
    params:
      metric: ['scitag_networks_bps']
      key: ['ip6source','ip6destination','map:[bits:ip6flowlabel:261884]:scitag']
      label: ['src','dst','scitag']
      value: ['bytes']
      scale: ['8']
      aggMode: ['sum']
      minValue: ['1000']
      maxFlows: ['100']
For example, the Prometheus scrape job above collects the data shown in the Browse Flows chart.
The chart above shows a Grafana dashboard displaying the scitag flow data.

Thursday, September 15, 2022

Low latency flow analytics


Real-time analytics on network flow data with Apache Pinot describes LinkedIn's flow ingestion and analytics pipeline for sFlow and IPFIX exports from network devices. The solution uses Apache Kafka message queues to connect LinkedIn's InFlow flow analyzer with the Apache Pinot datastore to support low latency queries. The article describes the scale of the monitoring system, InFlow receives 50k flows per second from over 100 different network devices on the LinkedIn backbone and edge devices and states InFlow requires storage of tens of TBs of data with a retention of 30 days. The article concludes, Following the successful onboarding of flow data to a real-time table on Pinot, freshness of data improved from 15 mins to 1 minute and query latencies were reduced by as much as 95%.
The sFlow-RT real-time analytics engine provides a faster, simpler, more scaleable, alternative for flow monitoring. sFlow-RT  radically simplifies the measurement pipeline, combining flow collection, enrichment, and analytics in a single programmable stage. Removing pipeline stages improves data freshness — flow measurements represent an up to the second view of traffic flowing through the monitored network devices. The improvement from minute to sub-second data freshness enhances automation use cases such as automated DDoS mitigation, load balancing, and auto-scaling (see Delay and stability).

An essential step in improving data freshness is eliminating IPFIX and migrating to an sFlow only network monitoring system. Rapidly detecting large flows, sFlow vs. NetFlow/IPFIX describes how the on-device flow cache component of IPFIX/NetFlow measurements adds an additional stage (and additional latency, anywhere from 1 to 30 minutes) to the flow analytics pipeline. On the other hand, sFlow is stateless, eliminates the flow cache, and guarantees sub-second freshness. Moving from IPFIX/NetFlow is straightforward as most of the leading router vendors now include sFlow support, see Real-time flow telemetry for routers. In addition, sFlow is widely supported in switches, making it possible to efficiently monitor every device in the data center.

Removing pipeline stages increases scaleability and reduces the cost of the solution. A single instance of sFlow-RT can monitor 10's of thousands of network devices and over a million flows per second, replacing large numbers of scale-out pipeline instances. Removing the need for distributed message queues improves resilience by decoupling the flow monitoring system from the network so that it can reliably deliver the visibility needed to manage network congestion "meltdown" events — see Who monitors the monitoring systems?

Introducing a programmable flow analytics stage before storing the data significantly reduces storage requirements (and improves query latency) since only metrics of interest will be computed and stored (see Flow metrics with Prometheus and Grafana).

The LinkedIn paper mentions that they are developing an eBPF Skyfall agent for monitoring hosts. The open source Host sFlow agent extends sFlow to hosts and can be deployed at scale today, see Real-time Kubernetes cluster monitoring example.

docker run -p 8008:8008 -p 6343:6343/udp sflow/prometheus
Trying out sFlow-RT is easy. For example, run the above command to start the analyzer using the pre-built sflow/prometheus Docker image. Configure sFlow agents to stream telemetry to the analyzer and access the through the web interface on port 8008 (see Getting Started). The default settings should work for most small to moderately sized networks. See Tuning Performance for tips on optimizing performance for larger sites.

Wednesday, August 31, 2022

DDoS Sonification

Sonification presents data as sounds instead of visual charts. One of the best known examples of sonification is the representation of radiation level as a click rate in a Geiger counter. This article describes ddos-sonify, an experiment to see if sound can be usefully employed to represent information about Distributed Denial of Service (DDoS) attacks. The DDoS attacks and BGP Flowspec responses testbed was used to create the video demonstration at the top of this page in which a series of simulated DDoS attacks are detected and mitigated. Play the video to hear the results.

The software uses the Tone.js library to control Web Audio sound generation functionality in a web browser.

var voices = {};
var loop;
var loopInterval = '4n';
$('#sonify').click(function() {
  if($(this).prop("checked")) {
    voices.synth = new Tone.PolySynth(Tone.Synth).toDestination();
    voices.metal = new Tone.PolySynth(Tone.MetalSynth).toDestination();
    voices.pluck = new Tone.PolySynth(Tone.PluckSynth).toDestination();
    voices.membrane = new Tone.PolySynth(Tone.MembraneSynth).toDestination();
    voices.am = new Tone.PolySynth(Tone.AMSynth).toDestination();
    voices.fm = new Tone.PolySynth(Tone.FMSynth).toDestination();
    voices.duo = new Tone.PolySynth(Tone.DuoSynth).toDestination();
    Tone.Transport.bpm.value=80;
    loop = new Tone.Loop((now) => {
      sonify(now);
    },loopInterval).start(0);
    Tone.Transport.start();
  } else {
    loop.stop();
    loop.dispose();
    Tone.Transport.stop();
  }
});
Clicking on the Convert charts to sound checkbox on the web page initializes the different sound synthesizers that will be used to create sounds and starts a timed loop that will periodically call the sonify() function convert current values of each of the metrics into sounds.
var metrics = [
  {name:'top-5-ip-flood', threshold:'threshold_ip_flood', voice:'synth'},
  {name:'top-5-ip-fragmentation', threshold:'threshold_ip_fragmentation', voice:'duo'},
  {name:'top-5-icmp-flood', threshold:'threshold_icmp_flood', voice:'pluck'},
  {name:'top-5-udp-flood', threshold:'threshold_udp_flood', voice:'membrane'},
  {name:'top-5-udp-amplification', threshold:'threshold_udp_amplification', voice:'metal'},
  {name:'top-5-tcp-flood', threshold:'threshold_tcp_flood', voice:'am'},
  {name:'top-5-tcp-amplification', threshold:'threshold_tcp_amplification', voice:'fm'}
];
var notes = ['C4','D4','E4','F4','G4','A4','B4','C5'];
function sonify(now) {
  var sounds = {};
  var max = {};
  metrics.forEach(function(metric) {
    let vals = db.trend.trends[metric.name];
    let topn = vals[vals.length - 1];
    let thresh = db.trend.values[metric.threshold];
    let chord = sounds[metric.voice];
    if(!chord) {
      chord = {};
      sounds[metric.voice] = chord;
    }
    for(var key in topn) {
      let [tgt,group,port] = key.split(',');
      let note = notes[port % notes.length];
      chord[note] = Math.max(chord[note] || 0, Math.min(1,topn[key] / thresh));
      max[metric.voice] = Math.max(max[metric.voice] || 0, chord[note]);
    };
  });
  var interval = Tone.Time(loopInterval).toSeconds();
  var delay = 0;
  for(let voice in sounds) {
    let synth = voices[voice];
    let chord = sounds[voice];
    let maxval = max[voice];
    if(maxval) {
      let volume = Math.min(0,(maxval - 1) * 20);
      synth.volume.value=volume;
      let note_array = [];
      for(let note in chord) {
        let val = chord[note];
        if((val / maxval) < 0.7) continue;
        note_array.push(note);
      }
      let duration = Tone.Time(maxval*interval).quantize('64n');
      if(duration > 0) synth.triggerAttackRelease(note_array,duration,now+delay);
    }
    delay += Tone.Time('16n').toSeconds();
  }
}
The metrics array identifies individual DDoS metrics and their related thresholds and associates them with a sound (voice). The sonify() function retrieves current values of each of the metrics and scales them by their respective threshold. Each metric value is mapped to a musical note based on the TCP/UDP port used in the attack. Different attack types are mapped to different voices, for example, a udp_amplification attack will have a metallic sound while a udp_flood attack will have a percussive sound. Volume and duration of notes are proportional to the intensity of the attack.

The net effect in a production network is of a quiet rythm of instruments. When a DDoS attack occurs, the notes associated with the particular attack become much louder and drown out the background sounds. Over time it is possible to recoginize the distinct sounds on each type of DDoS attack.

Tuesday, August 23, 2022

NVIDIA ConnectX SmartNICs

NVIDIA ConnectX SmartNICs offer best-in-class network performance, serving low-latency, high-throughput applications with one, two, or four ports at 10, 25, 40, 50, 100, 200, and up to 400 gigabits per second (Gb/s) Ethernet speeds.

This article describes how use the instrumentation built into ConnectX SmartNICs for data center wide network visibility. Real-time network telemetry for automation provides some background, giving an overview of the sFlow industry standard with an example of troubleshooting a high performance GPU compute cluster.

Linux as a network operating system describes how standard Linux APIs are used in NVIDIA Spectrum switches to monitor data center network performance. Linux Kernel Upstream Release Notes v5.19 describes recent driver enhancements for ConnectX SmartNICs that extend visibility to servers for end-to-end visibility into the performance of high performance distributed compute infrastructure.

The open source Host sFlow agent uses standard Linux APIs to configure instrumentation in switches and hosts, streaming the resulting measurements to analytics software in real-time for comprehensive data center wide visibility.

Packet sampling provides detailed visibility into traffic flowing across the network. Hardware packet sampling makes it possible to monitor 400 gigabits per second interfaces on the server at line rate with minimal CPU/memory overhead.
psample { group=1 egress=on }
dent { sw=off switchport=^eth[0-9]+$ }
The above Host sFlow configuration entries enable packet sampling on the host. Linux 4.11 kernel extends packet sampling support describes the Linux PSAMPLE netlink channel used by the network adapter to send packet samples to the Host sFlow agent. The dent module automatically configures hardware packet sampling on network interfaces matching the switchport pattern (eth0, eth1, .. in this example) using the Linux tc-sample API, directing the packet samples to be sent to the specified psample group
Visibility into dropped packets offers significant benefits for network troubleshooting, providing real-time network-wide visibility into the specific packets that were dropped as well the reason the packet was dropped. This visibility instantly reveals the root cause of drops and the impacted connections.
dropmon { group=1 start=on sw=on hw=on }
The above Host sFlow configuration entry enables hardware dropped packet monitoring on the network adapter hardware.
sflow {
  collector { ip=10.0.0.1 }
  psample { group=1 egress=on }
  dropmon { group=1 start=on sw=on hw=on }
  dent { sw=off switchport=^eth[0-9]+$ }
}
The above /etc/hsflowd.conf file shows a complete configuration. The centralized collector, 10.0.0.1, receives sFlow from all the servers and switches in the network to provide comprehensive end-to-end visibility.
The sFlow-RT analytics engine receives and analyzes the sFlow telemetry stream, providing real-time analytics to visibility and automation systems (e.g. Flow metrics with Prometheus and Grafana).

Tuesday, August 9, 2022

DDoS detection with advanced real-time flow analytics

The diagram shows two high bandwidth flows of traffic to the Customer Network, the first (shown in blue) is a bulk transfer of data to a big data application, and the second (shown in red) is a distributed denial of service (DDoS) attack in which large numbers of compromised hosts attempt to flood the link connecting the Customer Network to the upstream Transit Provider. Industry standard sFlow telemetry from the customer router streams to an instance of the sFlow-RT real-time analytics engine which is programmed to detect (and mitigate) the DDoS attack.

This article builds on the Docker testbed to demonstrate how advanced flow analytics can be used to separate the two types of traffic and detect the DDoS attack.

docker run --rm -d -e "COLLECTOR=host.docker.internal" -e "SAMPLING=100" \
--net=host -v /var/run/docker.sock:/var/run/docker.sock:ro \
--name=host-sflow sflow/host-sflow
First, start a Host sFlow agent using the pre-built sflow/host-sflow image to generate the sFlow telemetry that would stream from the switches and routers in a production deployment. 
setFlow('ddos_amplification', {
  keys:'ipdestination,udpsourceport',
  value: 'frames',
  values: ['count:ipsource']
});
setThreshold('ddos_amplification', {
  metric:'ddos_amplification',
  value: 10000,
  byFlow:true,
  timeout: 2
});
setEventHandler(function(event) {
  var [ipdestination,udpsourceport] = event.flowKey.split(',');
  var [sourcecount] = event.values;
  if(sourcecount === 1) {
    logInfo("bulk transfer to " + ipdestination);
  } else {
    logInfo("DDoS port " + udpsourceport + " against " + ipdestination);
  }
},['ddos_amplification']);
The ddos.js script above provides a simple demonstration of sFlow-RT's advanced flow analytics. The setFlow() function defines the a flow signature for detecting UDP amplification attacks, identifying the targetted IP address and the amplification protocol. In addition to the primary value of frames per second, a secondary value counting the number of ipsource addresses has been included. The setThreshold() function causes an event to by generated whenever a flow exceeds 10,000 frames per second. Finally, the setEventHandler() function defines how the events will be processed. See Writing Applications for more information on developing sFlow-RT applications.
docker run --rm -v $PWD/ddos.js:/sflow-rt/ddos.js \
-p 8008:8008 -p 6343:6343/udp --name sflow-rt \
sflow/prometheus -Dscript.file=ddos.js
Start sFlow-RT using pre-built sflow/prometheus image.
docker run --rm -it sflow/hping3 --flood --udp -k \
-p 443 host.docker.internal
In a separate window, simulate a bulk tranfer using pre-built sflow/hping3 image (use CTL+C to stop the attack).
2022-08-09T00:03:20Z INFO: bulk transfer to 192.168.65.2
The transfer will be immediately detected and logged in the sFlow-RT window.
docker run --rm -it sflow/hping3 --flood --udp -k \
--rand-source -s 53 host.docker.internal
Simulate a UDP amplification attack.
2022-08-09T00:05:19Z INFO: DDoS port 53 against 192.168.65.2
The attack will be immmediately detected and logged in the sFlow-RT window.

The open source sFlow-RT ddos-protect application is a full featured DDoS mitigation solution that uses the advanced flow analytics features described in this article to detect a wide range of volumetric attacks. In addition, ddos-protect can automatically mitigate attacks using BGP remotely triggered blackhole (RTBH) or BGP Flowspec actions. DDoS protection quickstart guide describes how to test, deploy, and monitor the DDoS mitigation solution with examples using Arista, Cisco, and Juniper routers.

Friday, July 1, 2022

SR Linux in Containerlab

This article uses Containerlab to emulate a simple network and experiment with Nokia SR Linux and sFlow telemetry. Containerlab provides a convenient method of emulating network topologies and configurations before deploying into production on physical switches.

curl -O https://raw.githubusercontent.com/sflow-rt/containerlab/master/srlinux.yml

Download the Containerlab topology file.

containerlab deploy -t srlinux.yml

Deploy the topology.

docker exec -it clab-srlinux-h1 traceroute 172.16.2.2

Run traceroute on h1 to verify path to h2.

traceroute to 172.16.2.2 (172.16.2.2), 30 hops max, 46 byte packets
 1  172.16.1.1 (172.16.1.1)  2.234 ms  *  1.673 ms
 2  172.16.2.2 (172.16.2.2)  0.944 ms  0.253 ms  0.152 ms

Results show path to h2 (172.16.2.2) via router interface (172.16.1.1).

docker exec -it clab-srlinux-switch sr_cli

Access SR Linux command line on switch.

Using configuration file(s): []
Welcome to the srlinux CLI.
Type 'help' (and press <ENTER>) if you need any help using this.
--{ + running }--[  ]--                                                                                                                                                              
A:switch#

SR Linux CLI describes how to use the interface.

A:switch# show system sflow status

Get status of sFlow telemetry.

-------------------------------------------------------------------------
Admin State            : enable
Sample Rate            : 10
Sample Size            : 256
Total Samples          : <Unknown>
Total Collector Packets: 0
-------------------------------------------------------------------------
  collector-id     : 1
  collector-address: 172.100.100.5
  network-instance : default
  source-address   : 172.100.100.6
  port             : 6343
  next-hop         : <Unresolved>
-------------------------------------------------------------------------
-------------------------------------------------------------------------
--{ + running }--[  ]--

The output shows settings and operational status for sFlow configured on the switch.

Connect to the sFlow-RT Metric Browser application, http://localhost:8008/app/browse-metrics/html/index.html?metric=ifinoctets.

docker exec -it clab-srlinux-h1 iperf3 -c 172.16.2.2

Run an iperf3 throughput test between h1 and h2.

Connecting to host 172.16.2.2, port 5201
[  5] local 172.16.1.2 port 38522 connected to 172.16.2.2 port 5201
[ ID] Interval           Transfer     Bitrate         Retr  Cwnd
[  5]   0.00-1.00   sec   675 KBytes  5.52 Mbits/sec   54   22.6 KBytes       
[  5]   1.00-2.00   sec   192 KBytes  1.57 Mbits/sec   18   12.7 KBytes       
[  5]   2.00-3.00   sec   255 KBytes  2.09 Mbits/sec   16   1.41 KBytes       
[  5]   3.00-4.00   sec  0.00 Bytes  0.00 bits/sec    9   1.41 KBytes       
[  5]   4.00-5.00   sec  0.00 Bytes  0.00 bits/sec   18   1.41 KBytes       
[  5]   5.00-6.00   sec   255 KBytes  2.08 Mbits/sec   17   1.41 KBytes       
[  5]   6.00-7.00   sec   191 KBytes  1.56 Mbits/sec   10   8.48 KBytes       
[  5]   7.00-8.00   sec   191 KBytes  1.56 Mbits/sec    7   7.07 KBytes       
[  5]   8.00-9.00   sec   191 KBytes  1.56 Mbits/sec    7   8.48 KBytes       
[  5]   9.00-10.00  sec   191 KBytes  1.56 Mbits/sec   10   7.07 KBytes       
- - - - - - - - - - - - - - - - - - - - - - - - -
[ ID] Interval           Transfer     Bitrate         Retr
[  5]   0.00-10.00  sec  2.09 MBytes  1.75 Mbits/sec  166             sender
[  5]   0.00-10.27  sec  1.59 MBytes  1.30 Mbits/sec                  receiver

iperf Done.

The iperf3 test results show that the SR Linux dataplane implementation in the Docker container has severely limited forwarding performance, making the image unsuitable for emulating network traffic. In addition, the emulated forwarding plane does not support the packet sampling mechanism available on hardware switches that allows sFlow to provide real-time visibility into traffic flowing through the switch.

For readers interested in performance monitoring, the https://github.com/sflow-rt/containerlab repository provides examples showing performance monitoring of data center leaf / spine fabrics, EVPN visibility, and DDoS mitigation using Containerlab. These examples use Linux as a network operating system. In this case, the containers running on Containerlab use the Linux dataplane for maximumum performance. On physical switch hardware the Linux kernel can offload dataplane forwarding to the switch ASIC for line rate performance. 

containerlab destroy -t srlinux.yml

When you are finished, run the above command to stop the containers and free the resources associated with the emulation.

Thursday, June 2, 2022

Using Ixia-c to test RTBH DDoS mitigation

Remote Triggered Black Hole Scenario describes how to use the Ixia-c traffic generator to simulate a DDoS flood attack. Ixia-c supports the Open Traffic Generator API that is used in the article to program two traffic flows: the first representing normal user traffic (shown in blue) and the second representing attack traffic (show in red).

The article goes on to demonstrate the use of remotely triggered black hole (RTBH) routing to automatically mitigate the simulated attack. The chart above shows traffic levels during two simulated attacks. The DDoS mitigation controller is disabled during the first attack. Enabling the controller for the second attack causes to attack traffic to be dropped the instant it crosses the threshold.

The diagram shows the Containerlab topology used in the Remote Triggered Black Hole Scenario lab (which can run on a laptop). The Ixia traffic generator's eth1 interface represents the Internet and its eth2 interface represents the Customer Network being attacked. Industry standard sFlow telemetry from the Customer router, ce-router, streams to the DDoS mitigation controller (running an instance of DDoS Protect). When the controller detects a denial of service attack it pushed a control via BGP to the ce-router, which in turn pushes the control upstream to the service provider router, pe-router, which drops the attack traffic to prevent flooding of the ISP Circuit that would otherwise disrupt access to the Customer Network.

Arista, Cisco, and Juniper have added sFlow support to their BGP routers, see Real-time flow telemetry for routers, making it straightforward to take this solution from the lab to production. Support for Open Traffic Generator API across a range of platforms makes it possible to develop automated tests in the lab environment and apply them to production hardware.

Tuesday, April 26, 2022

BGP Remotely Triggered Blackhole (RTBH)

DDoS attacks and BGP Flowspec responses describes how to simulate and mitigate common DDoS attacks. This article builds on the previous examples to show how BGP Remotely Triggered Blackhole (RTBH) controls can be applied in situations where BGP Flowpsec is not available, or is unsuitable as a mitigation response.
docker run --rm -it --privileged --network host --pid="host" \
  -v /var/run/docker.sock:/var/run/docker.sock -v /run/netns:/run/netns \
  -v ~/clab:/home/clab -w /home/clab \
  ghcr.io/srl-labs/clab bash
Start Containerlab.
curl -O https://raw.githubusercontent.com/sflow-rt/containerlab/master/ddos.yml
Download the Containerlab topology file.
sed -i "s/\\.ip_flood\\.action=filter/\\.ip_flood\\.action=drop/g" ddos.yml
Change mitigation policy for IP Flood attacks from Flowspec filter to RTBH.
containerlab deploy -t ddos.yml
Deploy the topology.
Access the DDoS Protect screen at http://localhost:8008/app/ddos-protect/html/
docker exec -it clab-ddos-attacker hping3 \
--flood --rawip -H 47 192.0.2.129
Launch an IP Flood attack. The DDoS Protect dashboard shows that as soon as the ip_flood attack traffic reaches the threshold a control is implemented and the attack traffic is immediately dropped. The entire process between the attack being launched, detected, and mitigated happens within a second, ensuring minimal impact on network capacity and services.
docker exec -it clab-ddos-sp-router vtysh -c "show running-config"
See sp-router configuration.
Building configuration...

Current configuration:
!
frr version 8.2.2_git
frr defaults datacenter
hostname sp-router
no ipv6 forwarding
log stdout
!
ip route 203.0.113.2/32 Null0
!
interface eth2
 ip address 198.51.100.1/24
exit
!
router bgp 64496
 bgp bestpath as-path multipath-relax
 bgp bestpath compare-routerid
 neighbor fabric peer-group
 neighbor fabric remote-as external
 neighbor fabric description Internal Fabric Network
 neighbor fabric ebgp-multihop 255
 neighbor fabric capability extended-nexthop
 neighbor eth1 interface peer-group fabric
 no neighbor eth1 capability extended-nexthop
 !
 address-family ipv4 unicast
  redistribute connected route-map HOST_ROUTES
  neighbor fabric route-map RTBH in
 exit-address-family
 !
 address-family ipv4 flowspec
  neighbor fabric activate
 exit-address-family
exit
!
bgp community-list standard BLACKHOLE seq 5 permit blackhole
!
route-map HOST_ROUTES permit 10
 match interface eth2
exit
!
route-map RTBH permit 10
 match community BLACKHOLE
 set ip next-hop 203.0.113.2
exit
!
route-map RTBH permit 20
exit
!
ip nht resolve-via-default
!
end
The configuration creates null route for 203.0.113.2/32 and rewrites the next-hop address to 203.0.113.2 for routes that are marked with the BGP blackhole community.
docker exec -it clab-ddos-sp-router vtysh -c "show ip route"
Show the forwarding state on sp-router.
Codes: K - kernel route, C - connected, S - static, R - RIP,
       O - OSPF, I - IS-IS, B - BGP, E - EIGRP, N - NHRP,
       T - Table, v - VNC, V - VNC-Direct, A - Babel, F - PBR,
       f - OpenFabric,
       > - selected route, * - FIB route, q - queued, r - rejected, b - backup
       t - trapped, o - offload failure

K>* 0.0.0.0/0 [0/0] via 172.100.100.1, eth0, 12:36:08
C>* 172.100.100.0/24 is directly connected, eth0, 12:36:08
B>* 192.0.2.0/24 [20/0] via fe80::a8c1:abff:fe32:b21e, eth1, weight 1, 12:36:03
B>  192.0.2.129/32 [20/0] via 203.0.113.2 (recursive), weight 1, 00:00:04
  *                         unreachable (blackhole), weight 1, 00:00:04
C>* 198.51.100.0/24 is directly connected, eth2, 12:36:08
S>* 203.0.113.2/32 [1/0] unreachable (blackhole), weight 1, 12:36:08
Traffic to the victim IP address, 192.0.2.129, is directed to the 203.0.113.2 next-hop, where it is discarded before it can saturate the link to the customer router, ce-router.

Monday, April 4, 2022

Real-time flow telemetry for routers

The last few years have seen leading router vendors add support for sFlow monitoring technology that has long been the industry standard for switch monitoring. Router implementations of sFlow include:
  • Arista 7020R Series Routers, 7280R Series Routers, 7500R Series Routers, 7800R3 Series Routers
  • Cisco 8000 Series Routers, ASR 9000 Series Routers, NCS 5500 Series Routers
  • Juniper ACX Series Routers, MX Series Routers, PTX Series Routers
  • Huawei NetEngine 8000 Series Routers
Broad support of sFlow in both switching and routing platforms ensures comprehensive end-to-end monitoring of traffic, see sFlow.org Network Equipment for a list of vendors and products.
Note: Most routers also support Cisco Netflow/IPFIX. Rapidly detecting large flows, sFlow vs. NetFlow/IPFIX describes why you should choose sFlow if you are interested in real-time monitoring and control applications.
DDoS mitigation is a popular use case for sFlow telemetry in routers. The combination of sFlow for real-time DDoS detection with BGP RTBH / Flowspec mitigation on routing platforms makes for a compelling solution.
DDoS protection quickstart guide describes how to deploy sFlow along with BGP RTBH/Flowspec to automatically detect and mitigate DDoS flood attacks. The use of sFlow provides sub-second visibility into network traffic during the periods of high packet loss experienced during a DDoS attack. The result is a system that can reliably detect and respond to attacks in real-time.

The following links provide detailed configuration examples:

The examples above make use of the sFlow-RT real-time analytics platform, which provides real-time visibility to drive Software Defined Networking (SDN), DevOps and Orchestration tasks.

Tuesday, March 22, 2022

DDoS attacks and BGP Flowspec responses

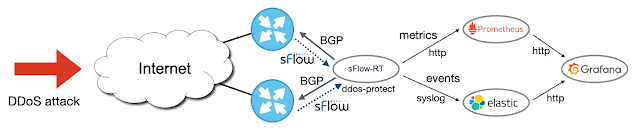
This article describes how to use the Containerlab DDoS testbed to simulate variety of flood attacks and observe the automated mitigation action designed to eliminate the attack traffic.

docker run --rm -it --privileged --network host --pid="host" \
  -v /var/run/docker.sock:/var/run/docker.sock -v /run/netns:/run/netns \
  -v ~/clab:/home/clab -w /home/clab \
  ghcr.io/srl-labs/clab bash
Start Containerlab.
curl -O https://raw.githubusercontent.com/sflow-rt/containerlab/master/ddos.yml
Download the Containerlab topology file.
containerlab deploy -t ddos.yml
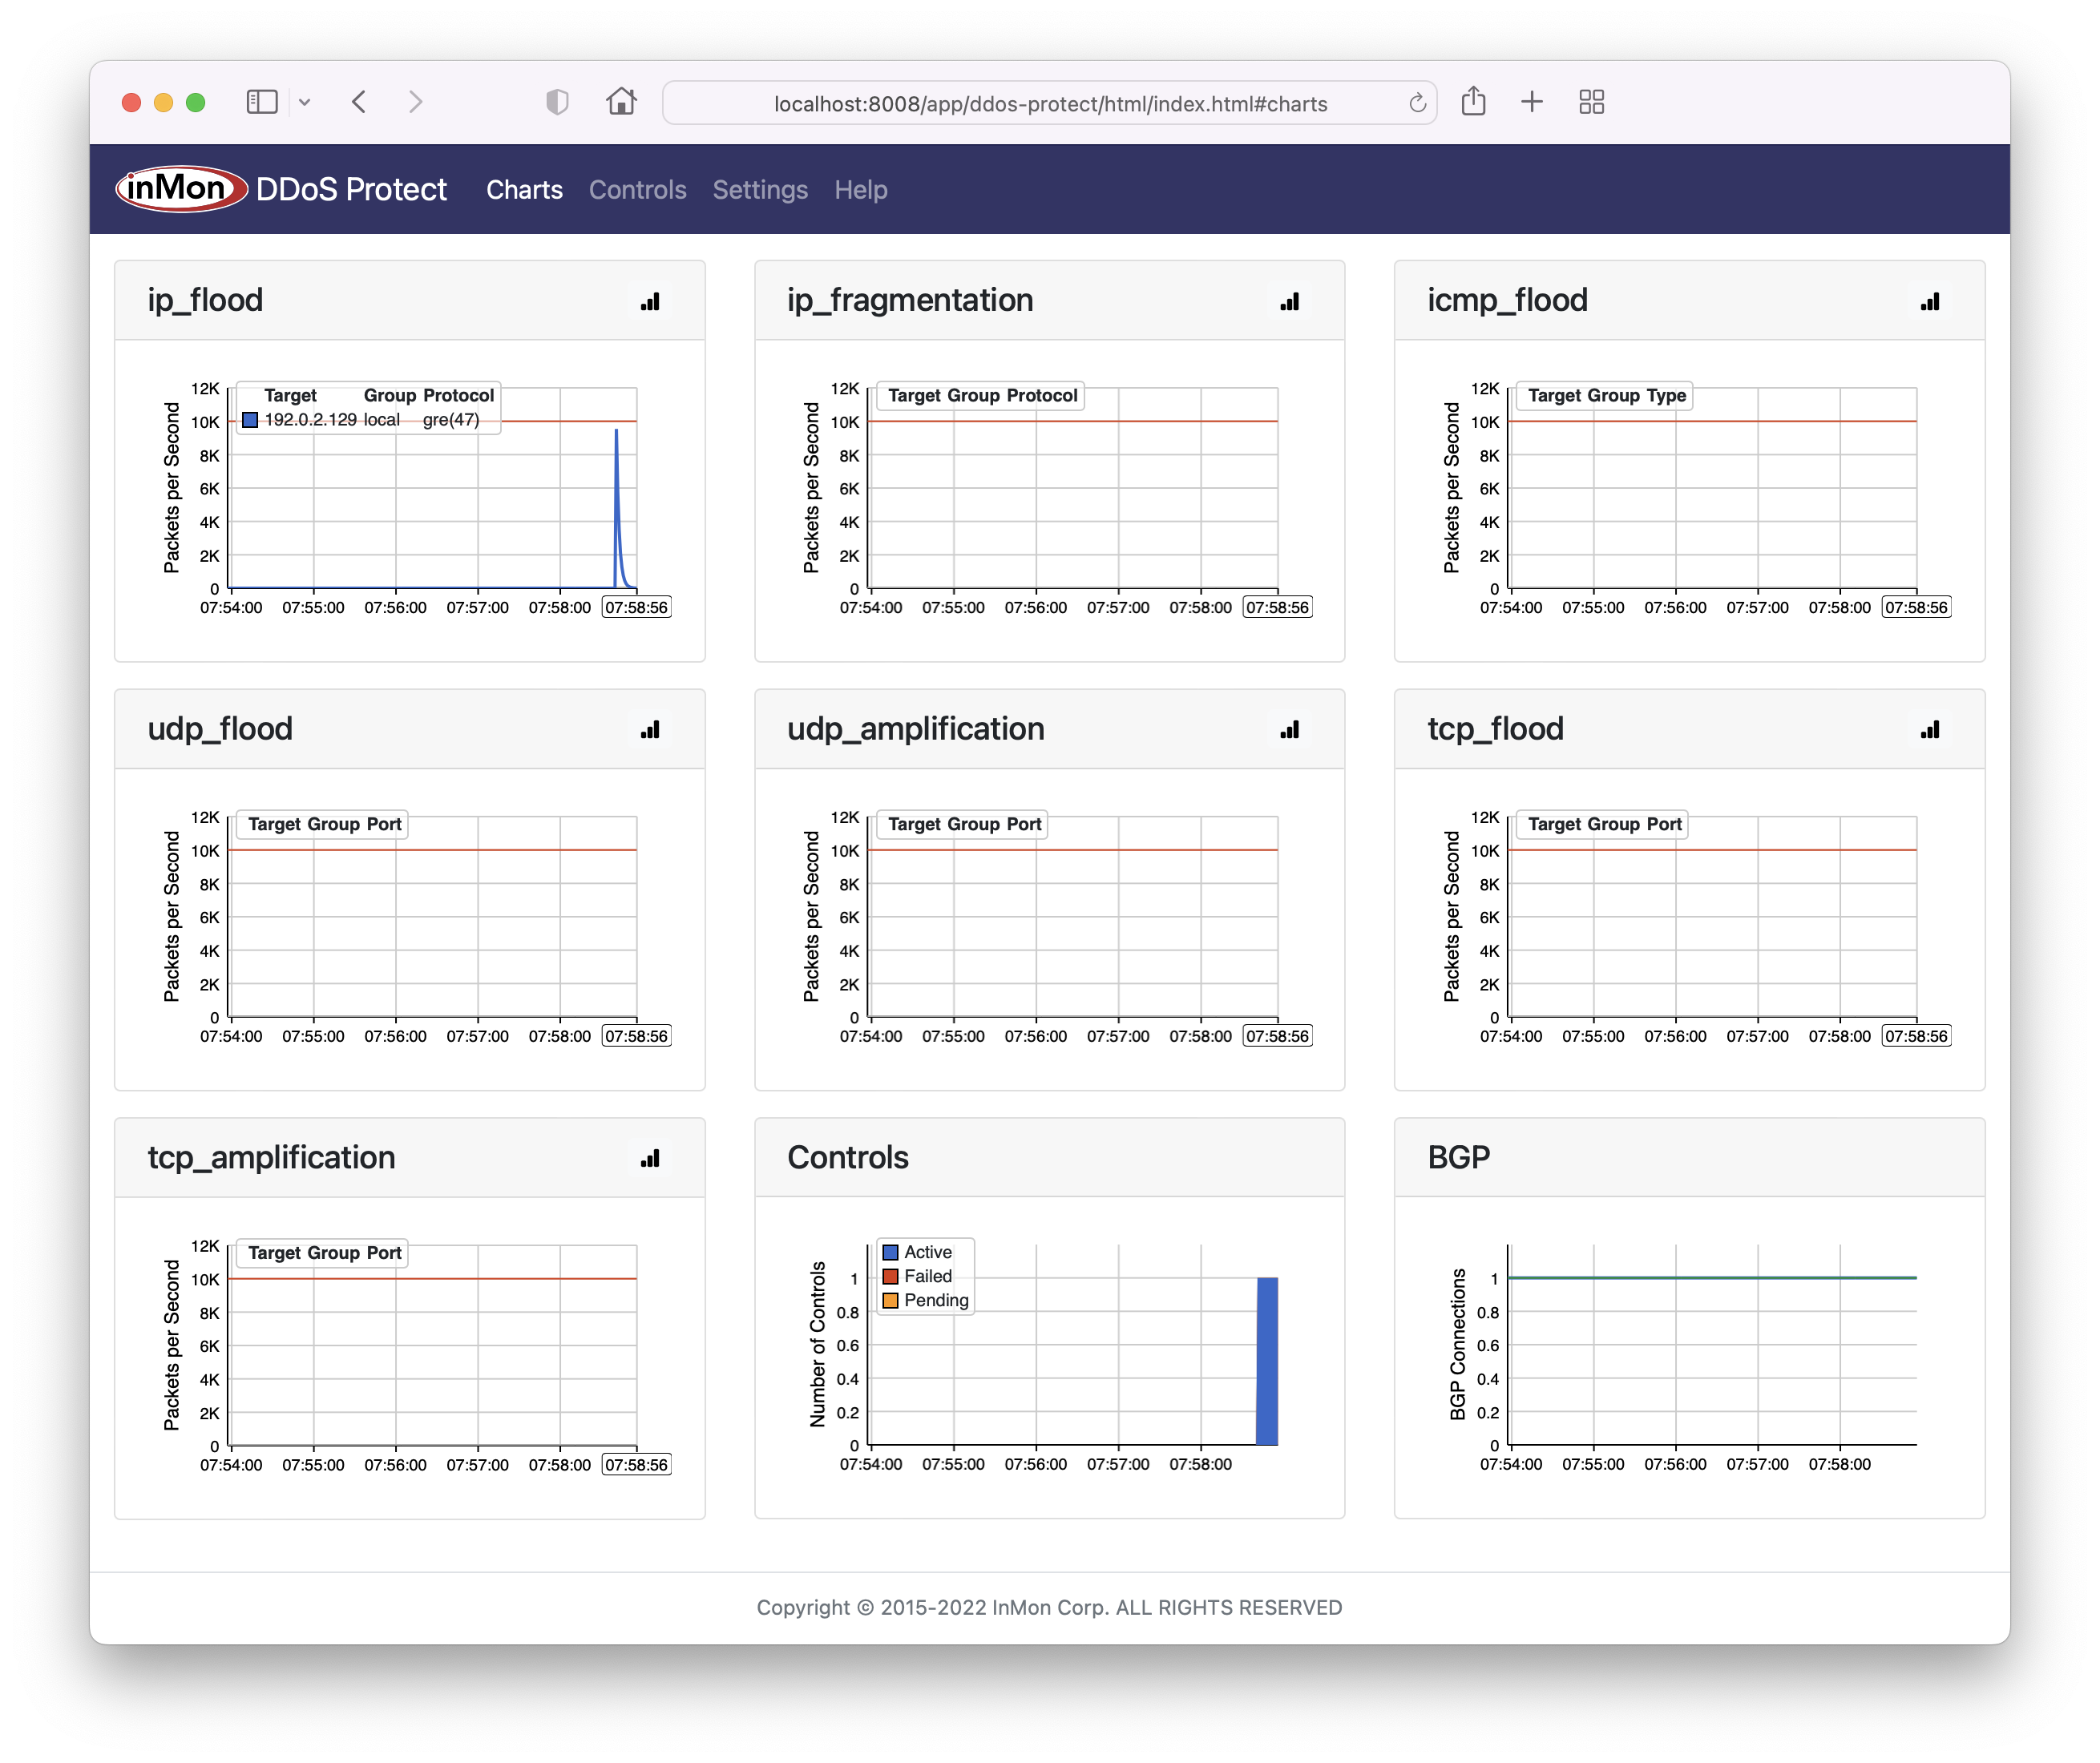
Deploy the topology and access the DDoS Protect screen at http://localhost:8008/app/ddos-protect/html/
docker exec -it clab-ddos-sp-router vtysh -c "show bgp ipv4 flowspec detail"

At any time, run the command above to see the BGP Flowspec rules installed on the sp-router. Simulate the volumetric attacks using hping3.

Note: While the hping3 --rand-source option to generate packets with random source addresses would create a more authentic DDoS attack simulation, the option is not used in these examples because the victims responses to the attack packets (ICMP Port Unreachable) will be sent back to the random addresses and may leak out of the Containerlab test network. Instead varying source / destination ports are used to create entropy in the attacks. 

When you are finished trying the examples below, run the following command to stop the containers and free the resources associated with the emulation.

containerlab destroy -t ddos.yml

Moving the DDoS mitigation solution from Containerlab to production is straighforward since sFlow and BGP Flowspec are widely available in routing platforms. The articles Real-time DDoS mitigation using BGP RTBH and FlowSpec, DDoS Mitigation with Cisco, sFlow, and BGP Flowspec, DDoS Mitigation with Juniper, sFlow, and BGP Flowspec, provide configuration examples for Arista, Cisco, Juniper routers respectively.

IP Flood

IP packets by target address and protocol. This is a catch all signature that will catch any volumetric attack against a protected address. Setting a high threshold for the generic flood attack allows the other, more targetted, signatures to trigger first and provide a more nuanced response.

docker exec -it clab-ddos-attacker hping3 \
--flood --rawip -H 47 192.0.2.129
Launch simulated IP flood attack against 192.0.2.129 using IP protocol 47 (GRE).
BGP flowspec entry: (flags 0x498)
	Destination Address 192.0.2.129/32
	IP Protocol = 47 
	FS:rate 0.000000
	received for 00:00:12
	not installed in PBR

Resulting Flowspec entry in sp-router. The filter blocks all IP protocol 47 (GRE) traffic to the targetted address 192.0.2.129.

IP Fragmentation

IP fragments by target address and protocol. There should be very few fragmented packets on a well configured network and the attack is typically designed to exhaust host resources, so a low threshold can be used to quickly mitigate these attacks.

docker exec -it clab-ddos-attacker hping3 \
--flood -f  -p ++1024 192.0.2.129
Launch simulated IP fragmentation attack against 192.0.2.129.
BGP flowspec entry: (flags 0x498)
	Destination Address 192.0.2.129/32
	IP Protocol = 6 
	Packet Fragment = 2
	FS:rate 0.000000
	received for 00:00:10
	not installed in PBR

Resulting Flowspec entry in sp-router. The filter blocks fragemented packets to the targetted address 192.0.2.129.

ICMP Flood

ICMP packets by target address and type. Examples include Ping Flood and Smurf attacks. 

docker exec -it clab-ddos-attacker hping3 \
--flood --icmp -C 0 192.0.2.129
Launch simulated ICMP flood attack using ICMP type 0 (Echo Reply) packets against 192.0.2.129.
BGP flowspec entry: (flags 0x498)
	Destination Address 192.0.2.129/32
	IP Protocol = 1 
	ICMP Type = 0 
	FS:rate 0.000000
	received for 00:00:13
	not installed in PBR

Resulting Flowspec entry in sp-router. The filter blocks ICMP type 0 packets to the targetted address 192.0.2.129.

UDP Flood

UDP packets by target address and destination port. The UDP flood attack can be designed to overload the targetted service or exhaust resources on middlebox devices. A UDP flood attack can also trigger a flood of ICMP Destination Port Unreachable responses from the targetted host to the, often spoofed, UDP packet source addresses.

docker exec -it clab-ddos-attacker hping3 \
--flood --udp -p 53 192.0.2.129
Launch simulated UDP flood attack against port 53 (DNS) on 192.0.2.129.
BGP flowspec entry: (flags 0x498)
	Destination Address 192.0.2.129/32
	IP Protocol = 17 
	Destination Port = 53 
	FS:rate 0.000000
	received for 00:00:13
	not installed in PBR

Resulting Flowspec entry in sp-router. The filter blocks UDP packets with destination port 53 to the targetted address 192.0.2.129.

UDP Amplification

UDP packets by target address and source port. Examples include DNS, NTP, SSDP, SNMP, Memcached, and CharGen reflection attacks. 

docker exec -it clab-ddos-attacker hping3 \
--flood --udp -k -s 53 -p ++1024 192.0.2.129

Launch simulated UDP amplification attack using port 53 (DNS) as an amplifier to target 192.0.2.129.

BGP flowspec entry: (flags 0x498)
	Destination Address 192.0.2.129/32
	IP Protocol = 17 
	Source Port = 53 
	FS:rate 0.000000
	received for 00:00:43
	not installed in PBR

Resulting Flowspec entry in sp-router. The filter blocks UDP packets with source port 53 to the targetted address 192.0.2.129.

TCP Flood

TCP packets by target address and destination port. A TCP flood attack can also trigger a flood of ICMP Destination Port Unreachable responses from the targetted host to the, often spoofed, TCP packet source addresses.

This signature does not look at TCP flags, for example to identify SYN flood attacks, since Flowspec filters are stateless and filtering all packets with the SYN flag set would effectively block all connections to the target host. However, this control can help mitigate large volume TCP flood attacks (through the use of a limit or redirect Flowspec action) so that the traffic doesn't overwhelm layer 4 mitigation running on load balancers or hosts, using SYN cookies for example.

docker exec -it clab-ddos-attacker hping3 \
--flood -p 80 192.0.2.129

Launch simulated TCP flood attack against port 80 (HTTP) on 192.0.2.129.

BGP flowspec entry: (flags 0x498)
	Destination Address 192.0.2.129/32
	IP Protocol = 6 
	Destination Port = 80 
	FS:rate 0.000000
	received for 00:00:17
	not installed in PBR

Resulting Flowspec entry in sp-router. The filter blocks TCP packets with destination port 80 to the targetted address 192.0.2.129.

TCP Amplification

TCP SYN-ACK packets by target address and source port. In this case filtering on the TCP flags is very useful, effectively blocking the reflection attack, while allowing connections to the target host. Recent examples target vulerable middlebox devices to amplify the TCP reflection attack.

docker exec -it clab-ddos-attacker hping3 \
--flood -k -s 80 -p ++1024 -SA 192.0.2.129
Launch simulated TCP amplification attack using port 80 (HTTP) as an amplifier to target 192.0.2.129.
BGP flowspec entry: (flags 0x498)
	Destination Address 192.0.2.129/32
	IP Protocol = 6 
	Source Port = 80 
	TCP Flags = 18
	FS:rate 0.000000
	received for 00:00:11
	not installed in PBR

Resulting Flowspec entry in sp-router. The filter blocks TCP packets with source port 80 to the targetted address 192.0.2.129.

Wednesday, March 16, 2022

Containerlab DDoS testbed

Real-time telemetry from a 5 stage Clos fabric describes lightweight emulation of realistic data center switch topologies using Containerlab. This article extends the testbed to experiment with distributed denial of service (DDoS) detection and mitigation techniques described in Real-time DDoS mitigation using BGP RTBH and FlowSpec.
docker run --rm -it --privileged --network host --pid="host" \
  -v /var/run/docker.sock:/var/run/docker.sock -v /run/netns:/run/netns \
  -v ~/clab:/home/clab -w /home/clab \
  ghcr.io/srl-labs/clab bash
Start Containerlab.
curl -O https://raw.githubusercontent.com/sflow-rt/containerlab/master/ddos.yml
Download the Containerlab topology file.
containerlab deploy -t ddos.yml
Finally, deploy the topology.
Connect to the web interface, http://localhost:8008. The sFlow-RT dashboard verifies that telemetry is being received from 1 agent (the Customer Network, ce-router, in the diagram above). See the sFlow-RT Quickstart guide for more information.
Now access the DDoS Protect application at http://localhost:8008/app/ddos-protect/html/. The BGP chart at the bottom right verifies that BGP connection has been established so that controls can be sent to the Customer Router, ce-router.
docker exec -it clab-ddos-attacker hping3 --flood --udp -k -s 53 192.0.2.129
Start a simulated DNS amplification attack using hping3.
The udp_amplification chart shows that traffic matching the attack signature has crossed the threshold. The Controls chart shows that a control blocking the attack is Active.
Clicking on the Controls tab shows a list of the active rules. In this case the target of the attack 192.0.2.129 and the protocol 53 (DNS) has been identified.
docker exec -it clab-ddos-sp-router vtysh -c "show bgp ipv4 flowspec detail"
The above command inspects the BGP Flowspec rules on Service Provider, sp-router, router.
BGP flowspec entry: (flags 0x498)
	Destination Address 192.0.2.129/32
	IP Protocol = 17 
	Source Port = 53 
	FS:rate 0.000000
	received for 00:01:41
	not installed in PBR

Displayed  1 flowspec entries
The output verifies that the filtering rule to block the DDoS attack has been received by the Transit Provider router, sp-router, where it can block the traffic and protect the customer network. However, the not installed in PBR message indicates that the filter hasn't been installed since the FRRouting software being used for this demonstration currently doesn't have the required functionality. Once FRRouting adds support for filtering using Linux tc flower, it will be possible to use BGP Flowspec to block attacks at line rate on commodity white box hardware, see  Linux as a network operating system.
containerlab destroy -t ddos.yml
When you are finished, run the above command to stop the containers and free the resources associated with the emulation.

Moving the DDoS mitigation solution from Containerlab to production is straighforward since sFlow and BGP Flowspec are widely available in routing platforms. The articles Real-time DDoS mitigation using BGP RTBH and FlowSpec, DDoS Mitigation with Cisco, sFlow, and BGP Flowspec, DDoS Mitigation with Juniper, sFlow, and BGP Flowspec, provide configuration examples for Arista, Cisco, Juniper routers respectively.

Monday, March 14, 2022

Real-time EVPN fabric visibility

Real-time telemetry from a 5 stage Clos fabric describes lightweight emulation of realistic data center switch topologies using Containerlab. This article builds on the example to demonstrate visibility into Ethernet Virtual Private Network (EVPN) traffic as it crosses a routed leaf and spine fabric.
docker run --rm -it --privileged --network host --pid="host" \
  -v /var/run/docker.sock:/var/run/docker.sock -v /run/netns:/run/netns \
  -v ~/clab:/home/clab -w /home/clab \
  ghcr.io/srl-labs/clab bash
Start Containerlab.
curl -O https://raw.githubusercontent.com/sflow-rt/containerlab/master/evpn3.yml
Download the Containerlab topology file.
containerlab deploy -t evpn3.yml
Finally, deploy the topology.
docker exec -it clab-evpn3-leaf1 vtysh -c "show running-config"
See configuration of leaf1 switch.
Building configuration...

Current configuration:
!
frr version 8.1_git
frr defaults datacenter
hostname leaf1
no ipv6 forwarding
log stdout
!
router bgp 65001
 bgp bestpath as-path multipath-relax
 bgp bestpath compare-routerid
 neighbor fabric peer-group
 neighbor fabric remote-as external
 neighbor fabric description Internal Fabric Network
 neighbor fabric capability extended-nexthop
 neighbor eth1 interface peer-group fabric
 neighbor eth2 interface peer-group fabric
 !
 address-family ipv4 unicast
  network 192.168.1.1/32
 exit-address-family
 !
 address-family l2vpn evpn
  neighbor fabric activate
  advertise-all-vni
 exit-address-family
exit
!
ip nht resolve-via-default
!
end
The loopback address on the switch, 192.168.1.1/32, is advertised to neighbors so that the VxLAN tunnel endpoint is known to switches in the fabric. The address-family l2vpn evpn setting exchanges bridge tables across BGP connections so that they operate as a single virtual bridge.
docker exec -it clab-evpn3-h1 ping -c 3 172.16.10.2
Ping h2 from h1
PING 172.16.10.2 (172.16.10.2): 56 data bytes
64 bytes from 172.16.10.2: seq=0 ttl=64 time=0.346 ms
64 bytes from 172.16.10.2: seq=1 ttl=64 time=0.466 ms
64 bytes from 172.16.10.2: seq=2 ttl=64 time=0.152 ms

--- 172.16.10.2 ping statistics ---
3 packets transmitted, 3 packets received, 0% packet loss
round-trip min/avg/max = 0.152/0.321/0.466 ms
The results verify that there is layer 2 connectivity between the two hosts.
docker exec -it clab-evpn3-leaf1 vtysh -c "show evpn vni"
List the Virtual Network Identifiers (VNIs) on leaf1.
VNI        Type VxLAN IF              # MACs   # ARPs   # Remote VTEPs  Tenant VRF                           
10         L2   vxlan10               2        0        1               default
We can see one virtual network, VNI 10.
docker exec -it clab-evpn3-leaf1 vtysh -c "show evpn mac vni 10"
Show the virtual bridge table for VNI 10 on leaf1.
Number of MACs (local and remote) known for this VNI: 2
Flags: N=sync-neighs, I=local-inactive, P=peer-active, X=peer-proxy
MAC               Type   Flags Intf/Remote ES/VTEP            VLAN  Seq #'s
aa:c1:ab:25:7f:a2 remote       192.168.1.2                          0/0
aa:c1:ab:25:76:ee local        eth3                                 0/0
The MAC address, aa:c1:ab:25:76:ee, is reported as locally attached to port eth3. The MAC address, aa:c1:ab:25:7f:a2, is reported as remotely accessable through the VxLAN tunnel to 192.168.1.2, the loopback address for leaf2.
The screen capture shows a real-time view of traffic flowing across the network during an iperf3 test. Connect to the sFlow-RT Flow Browser application, http://localhost:8008/app/browse-flows/html/, or click here for a direct link to a chart with the settings shown above.

The chart shows VxLAN encapsulated Ethernet packets routed across the leaf and spine fabric. The inner and outer addresses are shown, allowing the flow to be traced end-to-end. See Defining Flows for more information.

docker exec -it clab-evpn3-h1 iperf3 -c 172.16.10.2
Each of the hosts in the network has an iperf3 server, so running the above command will test bandwidth between h1 and h2. The flow should immediately appear in the Flow Browser chart.
containerlab destroy -t evpn3.yml
When you are finished, run the above command to stop the containers and free the resources associated with the emulation.

Moving the monitoring solution from Containerlab to production is straightforward since sFlow is widely implemented in datacenter equipment from vendors including: A10, Arista, Aruba, Cisco, Edge-Core, Extreme, Huawei, Juniper, NEC, Netgear, Nokia, NVIDIA, Quanta, and ZTE.