
This article offers a response, describing how to introduce an uncorrelated monitor-of-monitors into the data center to provide real-time visibility that survives when the primary monitoring systems fail.
Summary of the AWS Service Event in the Northern Virginia (US-EAST-1) Region, This congestion immediately impacted the availability of real-time monitoring data for our internal operations teams, which impaired their ability to find the source of congestion and resolve it. December 10th, 2021
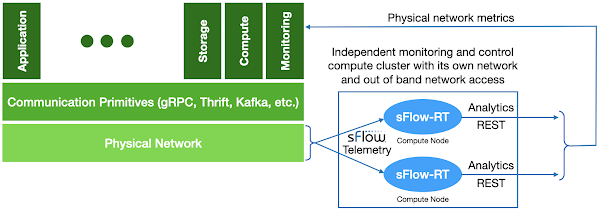
Standardizing on a small set of communication primitives (gRPC, Thrift, Kafka, etc.) simplifies the creation of large scale distributed services. The communication primitives abstract the physical network to provide reliable communication to support distributed services running on compute nodes. Monitoring is typically regarded as a distributed service that is part of the compute infrastructure, relying on agents on compute nodes to transmit measurements to scale out analysis, storage, automation, and presentation services.
System wide failures occur when the network abstraction fails and the limitations of the physical network infrastructure intrude into the overlaid monitoring, compute, storage, and application services. Physical network service failure is the Achilles heel of distributed compute infrastructure since the physical network is the glue that ties the infrastructure together.
However, the physical network is also a solution to the monitoring problem, providing an independent uncorrelated point of observation that has visibility into all the physical network resources and the services that run over them.
The industry standard sFlow measurement system, implemented by all major data center network equipment vendors, is specifically designed to address the challenge of monitoring large scale switched networks. The sFlow specification embeds standard instrumentation into the hardware of each switch, making monitoring an integral part of the function of the switch, and ensuring that monitoring capacity scales out as network size increases.
The diagram at the top of this article shows the elements of an sFlow monitoring system designed to provide independent visibility into large scale data center network infrastructure.
Each network device can be configured to send sFlow telemetry to at least two destinations. In the diagram two independent instances of the sFlow-RT real-time analytics engine are deployed on two separate compute nodes, each receiving its own stream of telemetry from all devices in the network. Since both sFlow-RT instances receive the same telemetry stream, they independently maintain copies of the network state that can be separately queried, ensuring availability in the event of a node failure.
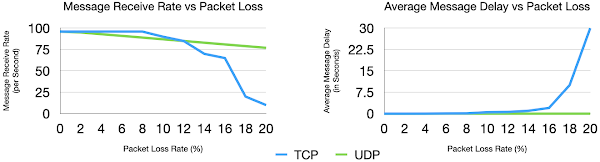
Note: Tollerance to packet loss allows sFlow to be sent inband to reduce load on out-of-band management networks without significant loss of visibility.
Scalability is ensured by sFlow's scale out hardware-based instrumentation. Leveraging the collective capability of the distributed instrumentation allows each sFlow-RT instance to monitor the current state of the entire data center network.
Tuning Performance describes how to optimize sFlow-RT performance for large scale monitoring.
The compute nodes hosting sFlow-RT instances should be physically separate from production compute service and have an independent network with out of band access so that measurements are available in cases were network performance issues have disrupted the production compute service.
This design is intentionally minimalist in order to reliably deliver real-time visibility during periods of extreme network congestion when all other systems fail.
In Failure Modes and Continuous Resilience, Adrian Cockroft states, The first technique is the most generally useful. Concentrate on rapid detection and response. In the end, when you’ve done everything you can do to manage failures you can think of, this is all you have left when that weird complex problem that no-one has ever seen before shows up!
With the state of the network stored in memory, each sFlow-RT instance provides an up to the second view of network performance with query response times measured in milliseconds. Queries are optimized to quickly diagnose network problems:
- Detect network congestion
- Identify traffic driving congestion
- Locate control points to mitigate congestion
- Filtering out DDoS traffic
- Shed non-essential services
- Re-routing traffic
- Shaping traffic
Physical network visibility has utility beyond addressing extreme congestion events, feeding physical network flow analytics into production monitoring systems augments visibility and provides useful information for intrusion detection, capacity planning, workload placement, autoscaling, and service optimization. In addition, comparing the independently generated flow metrics profiling production services with the metrics generated by the production monitoring systems provides an early warning of monitoring system reliability. Finally, the low latency of network flow metrics are a leading indicator of performance that can be used to improve the agility of production monitoring and control.
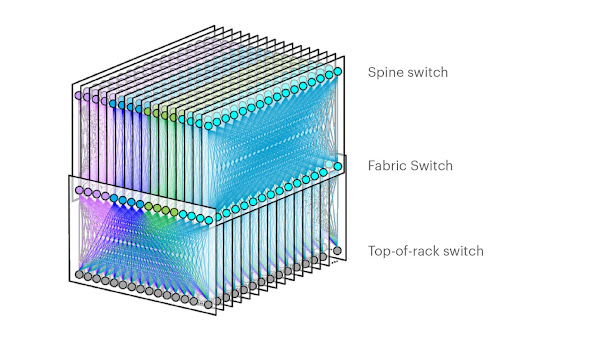
Getting started with sFlow is easy. Ideally, enable sFlow monitoring on the switches in a pod and install an instance of sFlow-RT to see traffic in your own environment, alternatively, Real-time telemetry from a 5 stage Clos fabric describes a lightweight emulation of realistic data center switch topologies using Docker and Containerlab that allows you to experiment with real-time sFlow telemetry and analytics before deploying into production.
Thanks, this is a useful idea. I do like the use of sflow to see what's happening at a low level, and AWS has the ability to export network flow records as well.
ReplyDelete