Showing posts with label Linux. Show all posts

Friday, July 11, 2025

Tracing network packets with eBPF and pwru

pwru (packet, where are you?) is an open source tool from Cilium that used eBPF instrumentation in recent Linux kernels to trace network packets through the kernel.

In this article we will use Multipass to create a virtual machine to experiment with pwru. Multipass is a command line tool for running Ubuntu virtual machines on Mac or Windows. Multipass uses the native virtualization capabilities of the host operating system to simplify the creation of virtual machines.

multipass launch --name=ebpf noble
multipass exec ebpf -- sudo apt update
multipass exec ebpf -- sudo apt -y install git clang llvm make libbpf-dev flex bison golang
multipass exec ebpf -- git clone https://github.com/cilium/pwru.git
multipass exec ebpf --working-directory pwru -- make
multipass exec ebpf -- sudo ./pwru/pwru -h
Run the commands above to create the virtual machine and build pwru from sources.
multipass exec ebpf -- sudo ./pwru/pwru port https
Run pwru to trace https traffic on the virtual machine.
multipass exec ebpf -- curl https://sflow-rt.com
In a second window, run the above command to generate an https request from the virtual machine.
SKB                CPU PROCESS          NETNS      MARK/x        IFACE       PROTO  MTU   LEN   TUPLE FUNC
0xffff9fc40335a0e8 0   ~r/bin/curl:8966 4026531840 0               0         0x0000 1500  60    192.168.66.3:47460->54.190.130.38:443(tcp) ip_local_out
0xffff9fc40335a0e8 0   ~r/bin/curl:8966 4026531840 0               0         0x0000 1500  60    192.168.66.3:47460->54.190.130.38:443(tcp) __ip_local_out
0xffff9fc40335a0e8 0   ~r/bin/curl:8966 4026531840 0               0         0x0800 1500  60    192.168.66.3:47460->54.190.130.38:443(tcp) ip_output
0xffff9fc40335a0e8 0   ~r/bin/curl:8966 4026531840 0             ens3:2      0x0800 1500  60    192.168.66.3:47460->54.190.130.38:443(tcp) nf_hook_slow
0xffff9fc40335a0e8 0   ~r/bin/curl:8966 4026531840 0             ens3:2      0x0800 1500  60    192.168.66.3:47460->54.190.130.38:443(tcp) apparmor_ip_postroute
0xffff9fc40335a0e8 0   ~r/bin/curl:8966 4026531840 0             ens3:2      0x0800 1500  60    192.168.66.3:47460->54.190.130.38:443(tcp) ip_finish_output
0xffff9fc40335a0e8 0   ~r/bin/curl:8966 4026531840 0             ens3:2      0x0800 1500  60    192.168.66.3:47460->54.190.130.38:443(tcp) __ip_finish_output
0xffff9fc40335a0e8 0   ~r/bin/curl:8966 4026531840 0             ens3:2      0x0800 1500  60    192.168.66.3:47460->54.190.130.38:443(tcp) ip_finish_output2
0xffff9fc40335a0e8 0   ~r/bin/curl:8966 4026531840 0             ens3:2      0x0800 1500  60    192.168.66.3:47460->54.190.130.38:443(tcp) neigh_resolve_output
0xffff9fc40335a0e8 0   ~r/bin/curl:8966 4026531840 0             ens3:2      0x0800 1500  60    192.168.66.3:47460->54.190.130.38:443(tcp) eth_header
0xffff9fc40335a0e8 0   ~r/bin/curl:8966 4026531840 0             ens3:2      0x0800 1500  60    192.168.66.3:47460->54.190.130.38:443(tcp) skb_push
0xffff9fc40335a0e8 0   ~r/bin/curl:8966 4026531840 0             ens3:2      0x0800 1500  74    192.168.66.3:47460->54.190.130.38:443(tcp) __dev_queue_xmit
0xffff9fc40335a0e8 0   ~r/bin/curl:8966 4026531840 0             ens3:2      0x0800 1500  74    192.168.66.3:47460->54.190.130.38:443(tcp) qdisc_pkt_len_init
0xffff9fc40335a0e8 0   ~r/bin/curl:8966 4026531840 0             ens3:2      0x0800 1500  74    192.168.66.3:47460->54.190.130.38:443(tcp) netdev_core_pick_tx
0xffff9fc40335a0e8 0   ~r/bin/curl:8966 4026531840 0             ens3:2      0x0800 1500  74    192.168.66.3:47460->54.190.130.38:443(tcp) sch_direct_xmit
0xffff9fc40335a0e8 0   ~r/bin/curl:8966 4026531840 0             ens3:2      0x0800 1500  74    192.168.66.3:47460->54.190.130.38:443(tcp) validate_xmit_skb_list
0xffff9fc40335a0e8 0   ~r/bin/curl:8966 4026531840 0             ens3:2      0x0800 1500  74    192.168.66.3:47460->54.190.130.38:443(tcp) validate_xmit_skb
0xffff9fc40335a0e8 0   ~r/bin/curl:8966 4026531840 0             ens3:2      0x0800 1500  74    192.168.66.3:47460->54.190.130.38:443(tcp) netif_skb_features
0xffff9fc40335a0e8 0   ~r/bin/curl:8966 4026531840 0             ens3:2      0x0800 1500  74    192.168.66.3:47460->54.190.130.38:443(tcp) passthru_features_check
0xffff9fc40335a0e8 0   ~r/bin/curl:8966 4026531840 0             ens3:2      0x0800 1500  74    192.168.66.3:47460->54.190.130.38:443(tcp) skb_network_protocol
0xffff9fc40335a0e8 0   ~r/bin/curl:8966 4026531840 0             ens3:2      0x0800 1500  74    192.168.66.3:47460->54.190.130.38:443(tcp) skb_csum_hwoffload_help
0xffff9fc40335a0e8 0   ~r/bin/curl:8966 4026531840 0             ens3:2      0x0800 1500  74    192.168.66.3:47460->54.190.130.38:443(tcp) skb_checksum_help
0xffff9fc40335a0e8 0   ~r/bin/curl:8966 4026531840 0             ens3:2      0x0800 1500  74    192.168.66.3:47460->54.190.130.38:443(tcp) skb_ensure_writable
0xffff9fc40335a0e8 0   ~r/bin/curl:8966 4026531840 0             ens3:2      0x0800 1500  74    192.168.66.3:47460->54.190.130.38:443(tcp) validate_xmit_xfrm
0xffff9fc40335a0e8 0   ~r/bin/curl:8966 4026531840 0             ens3:2      0x0800 1500  74    192.168.66.3:47460->54.190.130.38:443(tcp) dev_hard_start_xmit
0xffff9fc40335a0e8 0   ~r/bin/curl:8966 4026531840 0             ens3:2      0x0800 1500  74    192.168.66.3:47460->54.190.130.38:443(tcp) start_xmit
0xffff9fc40335a0e8 0   ~r/bin/curl:8966 4026531840 0             ens3:2      0x0800 1500  74    192.168.66.3:47460->54.190.130.38:443(tcp) skb_clone_tx_timestamp
0xffff9fc40335a0e8 0   ~r/bin/curl:8966 4026531840 0             ens3:2      0x0800 1500  74    192.168.66.3:47460->54.190.130.38:443(tcp) xmit_skb
0xffff9fc40335a0e8 0   ~r/bin/curl:8966 4026531840 0             ens3:2      0x0800 1500  86    192.168.66.3:47460->54.190.130.38:443(tcp) skb_to_sgvec
0xffff9fc40335a0e8 0   ~r/bin/curl:8966 4026531840 0             ens3:2      0x0800 1500  86    192.168.66.3:47460->54.190.130.38:443(tcp) __skb_to_sgvec
The pwru output provides a detailed trace of each packet through the Linux stack, identifying each application, namespace, interface and kernel module traversed by the packet. Type Ctrl+C to stop the trace.
multipass exec ebpf -- sudo ufw default allow
multipass exec ebpf -- sudo ufw deny out to any port https
multipass exec ebpf -- sudo ufw enable
Now create a firewall rule to block outgoing https traffic and repeat the test
SKB                CPU PROCESS          NETNS      MARK/x        IFACE       PROTO  MTU   LEN   TUPLE FUNC
0xffff970bc5f568e8 0   ~r/bin/curl:7138 4026531840 0               0         0x0000 1500  60    192.168.67.5:38932->54.190.130.38:443(tcp) ip_local_out
0xffff970bc5f568e8 0   ~r/bin/curl:7138 4026531840 0               0         0x0000 1500  60    192.168.67.5:38932->54.190.130.38:443(tcp) __ip_local_out
0xffff970bc5f568e8 0   ~r/bin/curl:7138 4026531840 0               0         0x0800 1500  60    192.168.67.5:38932->54.190.130.38:443(tcp) nf_hook_slow
0xffff970bc5f568e8 0   ~r/bin/curl:7138 4026531840 0               0         0x0800 1500  60    192.168.67.5:38932->54.190.130.38:443(tcp) kfree_skb_reason(SKB_DROP_REASON_NETFILTER_DROP)
0xffff970bc5f568e8 0   ~r/bin/curl:7138 4026531840 0               0         0x0800 1500  60    192.168.67.5:38932->54.190.130.38:443(tcp) skb_release_head_state
0xffff970bc5f568e8 0   ~r/bin/curl:7138 4026531840 0               0         0x0800 0     60    192.168.67.5:38932->54.190.130.38:443(tcp) tcp_wfree
0xffff970bc5f568e8 0   ~r/bin/curl:7138 4026531840 0               0         0x0800 0     60    192.168.67.5:38932->54.190.130.38:443(tcp) skb_release_data
0xffff970bc5f568e8 0   ~r/bin/curl:7138 4026531840 0               0         0x0800 0     60    192.168.67.5:38932->54.190.130.38:443(tcp) kfree_skbmem
This time, the curl command hangs and the pwru trace shows that packets are being dropped in the Linux firewall.
multipass exec ebpf -- sudo ufw disable
Disable the firewall.

There are additional multipass commands available to manage the virtual machine.

multipass shell ebpf
Connect to the virtual machine and access a command shell.
multipass stop ebpf
Stop the virtual machine.
multipass start ebpf
Start the virtual machine.
multipass delete ebpf
multipass purge
Delete the virtual machine.

Monday, May 5, 2025

Multi-vendor support for dropped packet notifications


The sFlow Dropped Packet Notification Structures extension was published in October 2020. Extending sFlow to provide visibility into dropped packets offers significant benefits for network troubleshooting, providing real-time network wide visibility into the specific packets that were dropped as well the reason the packet was dropped. This visibility instantly reveals the root cause of drops and the impacted connections. Packet discard records complement sFlow's existing counter polling and packet sampling mechanisms and share a common data model so that all three sources of data can be correlated, for example, packet sampling reveals the top consumers of bandwidth on a link, helping to get to the root cause of congestion related packet drops reported for the link.

Today the following network operating systems include support for the drop notification extension in their sFlow agent implementations:

Two additional sFlow dropped packet notification implementations are in the pipeline and should be available later this year:

If your network vendor is on the list, follow the instructions in the linked articles to try out drop monitoring, if not, ask about your vendor's plans to implement the sFlow drop notification extension.

Monday, November 18, 2024

NVIDIA Cumulus Linux 5.11 for AI / ML


NVIDIA Cumulus Linux 5.11 includes major upgrades to the sFlow agent that fully exposes the advanced instrumentation built into NVIDIA Spectrum-X silicon. The enhanced real-time telemetry is particularly relevant to the AI / machine learning workloads that Spectrum-X is designed to handle.

With Cumulus Linux 5.11, the sFlow agent is easily configured using nvue commands, see Monitoring System Statistics and Network Traffic with sFlow:

nv set system sflow dropmon hw
nv set system sflow poll-interval 20
nv set system sflow collector 192.0.2.1
nv set system sflow state enabled
nv config apply

Note: In this case, enabling dropmon ensures that every dropped packet is captured, along with ingress port and drop reason (e.g. ttl_exceeded).

The same commands should be applied to every switch in the fabric for comprehensive visibility.

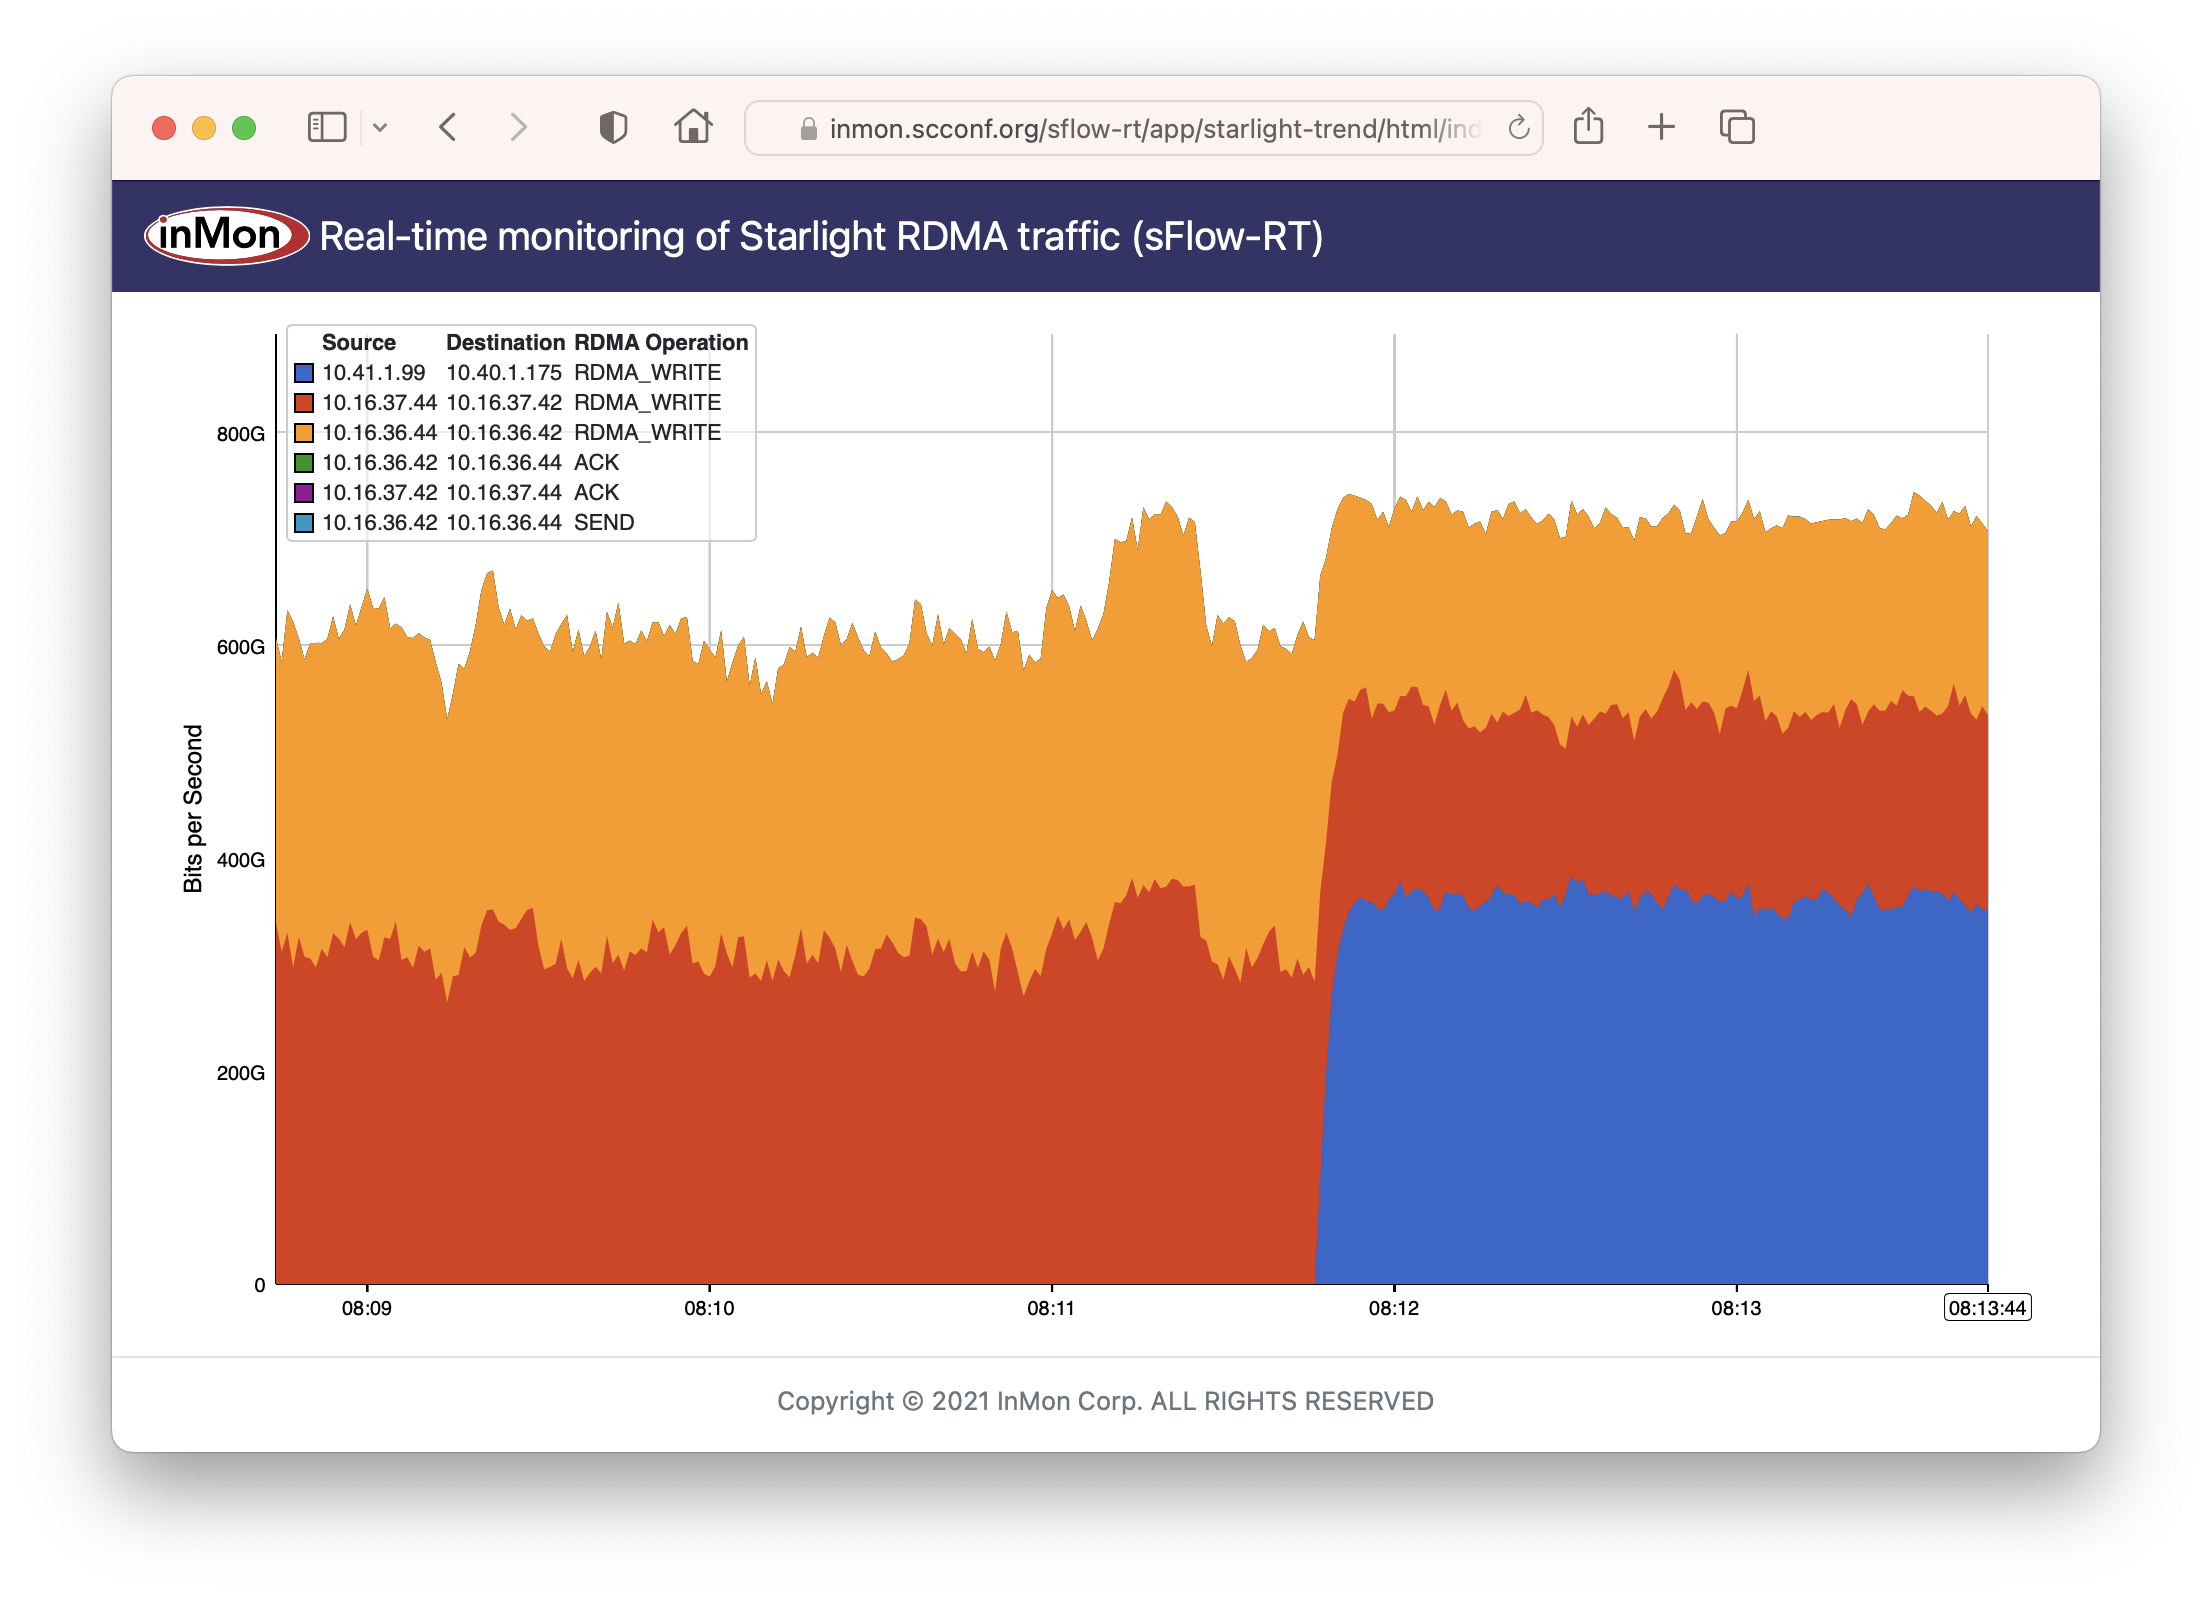
RDMA over Converged Ethernet (RoCE) describes how sFlow provides detailed visibility into RoCE flows used to move data between GPUs in an AI / ML data center fabric. The chart above from the RDMA network visibility demonstration at the SC22 conference shows that sFlow monitoring easily scales to the 400/800G speeds needed for machine learning.
In this example, the sFlow-RT real-time analytics engine receives sFlow telemetry from all the switches and servers in the fabric. Deploy real-time network dashboards using Docker compose describes how to quickly set up an sFlow-RT, Prometheus, Grafana stack to capture and display metrics. Dropped packet metrics with Prometheus and Grafana describes how to add a dashboard to display packet drop notifications.

If you are standing up a new NVIDIA Spectrum-X / Cumulus Linux network, enable sFlow on all the switches and set up an instance of sFlow-RT for the real-time fabric wide visibility into traffic flows and dropped packets. Real-time network visibility is particularly relevant to AI / ML data center networks where congestion and dropped packets can result in serious performance degradation.

Thursday, February 22, 2024

VyOS 1.4 LTS released

Protectli Vault - 4 Port

The VyOS 1.4.0 (Sagitta) LTS release announcement is exciting news! VyOS is an open source router operating system based on Linux that can be installed on commodity PC hardware - for optimal performance at least 1GB RAM and 4GB of storage space is recommended.

The new 1.4 LTS release includes a significantly enhanced implementation of industry standard sFlow telemetry based on the open source Host sFlow agent.

set system sflow interface eth0
set system sflow interface eth1
set system sflow interface eth2
set system sflow interface eth3
set system sflow polling 30
set system sflow sampling-rate 1000
set system sflow drop-monitor-limit 50
set system sflow server 192.0.2.100
Enter the commands above to enable sFlow monitoring on interfaces eth0, eth1, eth2, and eth3. Interface counters will be exported every 30 seconds, packets will be sampled with probability 1/1000, and up to 50 packet headers (and drop reasons) per second will collected from packets dropped by the router. The sFlow telemetry stream will be sent to an sFlow collector at 192.0.2.100.

Running Docker on the sFlow collector makes it easy to run a variety of sFlow analytics tools.

docker run --rm -p 6343:6343/udp sflow/sflowtool
Run the sflow/sflowtool image to decode and print the contents of the sFlow telemetry stream and verify receipt of data.
docker run --rm -p 6343:6343/udp sflow/tcpdump tcp port 80
Run the sflow/tcpdump image to decode and filter sampled packet headers. For more complex packet analysis tasks, try the sflow/tshark image.
Run the sflow/sflowtrend image to trend interface counters and top flows.
Deploy real-time network dashboards using Docker compose describes how to configure Prometheus and Grafana to capture time series data and create custom dashboards.
Dropped packet reason codes in VyOS describes how the new Linux kernel in VyOS 1.4 provides detailed visibility into every dropped packet (including the reason it was dropped). This cabability is used by the new sFlow agent implement the sFlow Dropped Packet Notification Structures extension to provide network-wide visibility into dropped packets.

Download VyOS today to try out the new features. Pre-built LTS images are available with paid support, but anyone can build an image from sources or download the latest rolling release.

Thursday, March 30, 2023

Dropped packet reason codes in Linux 6+ kernels

Using sFlow to monitor dropped packets describes support for standard sFlow Dropped Packet Notications in the open source Host sFlow agent. This article describes additional capabilities in Linux 6+ kernels that clarify reasons why packets are dropped in the kernel.

The recent addition of dropreason.h in Linux 6+ kernels provides detailed reasons for packet drops. The netlink drop_monitor API has been extended to include the NET_DM_ATTR_REASON attribute to report the drop reason, see net_dropmon.h.

The following example illustrates the value of the reason code in explaining Linux packet drops.

tcp_v4_rcv+0x7c/0xef0
The value of NET_DM_ATTR_SYMBOL shown above indicates that the packet was dropped in the tcp_v4_rcv function in Linux kernel at memory location 0x7c/0xef0. While this information is helpful, there are many reasons why a TCP packet may be dropped.
NO_SOCKET
In this case, the value of NET_DM_ATTR_REASON shown above indicates that the TCP packet was dropped because no application had opened a socket and so there was nowhere to deliver the packet.

In the case of Linux-based hardware switches or smart network adapters, where packet processing is offloaded to hardware, the netlink drop_monitor events include NET_DM_ATTR_HW_TRAP_GROUP_NAME and NET_DM_ATTR_HW_TRAP_NAME attributes and packet header information supplied by the hardware driver, see Devlink Trap.

The latest version of the open source Host sFlow agent includes adds support for the NET_DM_ATTR_REASON attribute to improve the accuracy of the sFlow drop_reason.

port_unreachable
In our example, the Host sFlow is now able to report port_unreachable as the reason for the dropped packet, rather than a generic unknown_l4 reason reported for older kernels.

The screen capture at the top of this article shows dropped packet information displayed in real-time using the Discard Browser application running on the sFlow-RT analytics engine. The chart demonstrates how the combination of information from the header of the dropped packet along with the reason for dropping the packet quickly gets to the root cause of the packet drop. In this case an attempt has been made from 172.16.1.174 to connect to 172.16.1.1 via telnet (tcp port 23) and telnet has not been enabled on the server so the packet was dropped - as it should be since telnet is not a secure method of connecting.

docker run --name sflow-rt -p 8008:8008 -p 6343:6343/udp -d sflow/prometheus

A quick way to experiment with sFlow is to run the pre-built sflow/prometheus image using Docker. The bundled Discard Browser with the settings shown in the screen capture can be launched by clicking here.

Monday, March 27, 2023

VyOS dropped packet notifications

VyOS with Host sFlow agent describes how to configure and analyze industry standard sFlow telemetry recently added to the VyOS open source router platform. This article discusses sFlow dropped packet notifications support added to the latest release.

Dropped packets have a profound impact on network performance and availability. Packet discards due to congestion can significantly impact application performance. Dropped packets due to black hole routes, expired TTLs, MTU mismatches, etc. can result in insidious connection failures that are time consuming and difficult to diagnose. Visibility into dropped packets offers significant benefits for network troubleshooting, providing real-time network-wide visibility into the specific packets that were dropped as well the reason the packet was dropped. This visibility instantly reveals the root cause of drops and the impacted connections.

vyos@vyos:~$ show version
Version:          VyOS 1.4-rolling-202303260914
Release train:    current

Built by:         autobuild@vyos.net
Built on:         Sun 26 Mar 2023 09:14 UTC
Build UUID:       72b34f74-bfcd-4b51-9b95-544319c2dac5
Build commit ID:  d68bda6a295ba9

Architecture:     x86_64
Boot via:         installed image
System type:       guest

Hardware vendor:  innotek GmbH
Hardware model:   VirtualBox
Hardware S/N:     0
Hardware UUID:    df0a2b79-b8c4-8342-a27f-76aa3e52ad6d

Copyright:        VyOS maintainers and contributors

Verify that the version of of VyOS is VyOS 1.4-rolling-202303260914 or later.

On VyOS dropped packet monitoring relies on instrumentation built into recent Linux kernels and exposed through the netlink drop_monitor API. Enabling drop_monitor in VyOS kernel configuration allows the Host sFlow agent to capture and export information on dropped packets.
set system sflow interface eth0
set system sflow interface eth1
set system sflow interface eth2
set system sflow polling 30
set system sflow sampling-rate 1000
set system sflow drop-monitor-limit 50
set system sflow server 10.0.0.30 port 6343
The drop-monitor-limit configuration entry enables dropped packet monitoring and sets a rate limit of 50 dropped packets notifications per second.
docker run --name sflow-rt -p 8008:8008 -p 6343:6343/udp -d sflow/prometheus

A quick way to experiment with sFlow is to run the pre-built sflow/prometheus image using Docker on the sFlow server (in this case on 10.0.0.30). The chart at the top of the page uses the Discard Browser application to display an up to the second view of packets dropped by the VyOS router, click on this link to open the application with the settings shown.

The chart shows the results of two tests, the first a failed attempt to connect to the VyOS router using telnet (telnet has been disabled in the router config), and the second a traceroute test between two hosts connected to the router. The reason field reports the sFlow drop reason code and the function reports the linux kernel function that dropped the packet. With the telnet test, the packet was dropped in the tcp_v4_rcv function and is reported as an unknown_l4 sFlow reason. In the case of the traceroute test, 3 packets were dropped in the ip_forward function and are reported as unknown_l3 reason.

Enabling sFlow dropped packet notifications on all switches, routers, and hosts provides end-to-end visibility into dropped packets, rapidly identifying the location and reason for packet drops as well as identifying the impacted services.

Dropped packet monitoring complements sFlow's existing counter polling and packet sampling mechanisms and shares a common data model so that all three sources of data can be correlated. For example, if packets are being discarded because of buffer exhaustion, the discard records don't necessarily tell the whole story. The discarded packets may represent mice flows that are victims of an elephant flow. Packet samples will reveal the traffic that isn't being dropped and provide a more complete picture. Counter data adds additional information such as CPU load, interface speed, link utilization, packet and discard rates that further completes the picture.

Tuesday, August 23, 2022

NVIDIA ConnectX SmartNICs

NVIDIA ConnectX SmartNICs offer best-in-class network performance, serving low-latency, high-throughput applications with one, two, or four ports at 10, 25, 40, 50, 100, 200, and up to 400 gigabits per second (Gb/s) Ethernet speeds.

This article describes how use the instrumentation built into ConnectX SmartNICs for data center wide network visibility. Real-time network telemetry for automation provides some background, giving an overview of the sFlow industry standard with an example of troubleshooting a high performance GPU compute cluster.

Linux as a network operating system describes how standard Linux APIs are used in NVIDIA Spectrum switches to monitor data center network performance. Linux Kernel Upstream Release Notes v5.19 describes recent driver enhancements for ConnectX SmartNICs that extend visibility to servers for end-to-end visibility into the performance of high performance distributed compute infrastructure.

The open source Host sFlow agent uses standard Linux APIs to configure instrumentation in switches and hosts, streaming the resulting measurements to analytics software in real-time for comprehensive data center wide visibility.

Packet sampling provides detailed visibility into traffic flowing across the network. Hardware packet sampling makes it possible to monitor 400 gigabits per second interfaces on the server at line rate with minimal CPU/memory overhead.
psample { group=1 egress=on }
dent { sw=off switchport=^eth[0-9]+$ }
The above Host sFlow configuration entries enable packet sampling on the host. Linux 4.11 kernel extends packet sampling support describes the Linux PSAMPLE netlink channel used by the network adapter to send packet samples to the Host sFlow agent. The dent module automatically configures hardware packet sampling on network interfaces matching the switchport pattern (eth0, eth1, .. in this example) using the Linux tc-sample API, directing the packet samples to be sent to the specified psample group. 
Visibility into dropped packets offers significant benefits for network troubleshooting, providing real-time network-wide visibility into the specific packets that were dropped as well the reason the packet was dropped. This visibility instantly reveals the root cause of drops and the impacted connections.
dropmon { group=1 start=on sw=on hw=on }
The above Host sFlow configuration entry enables hardware dropped packet monitoring on the network adapter hardware.
sflow {
  collector { ip=10.0.0.1 }
  psample { group=1 egress=on }
  dropmon { group=1 start=on sw=on hw=on }
  dent { sw=off switchport=^eth[0-9]+$ }
}
The above /etc/hsflowd.conf file shows a complete configuration. The centralized collector, 10.0.0.1, receives sFlow from all the servers and switches in the network to provide comprehensive end-to-end visibility.
The sFlow-RT analytics engine receives and analyzes the sFlow telemetry stream, providing real-time analytics to visibility and automation systems (e.g. Flow metrics with Prometheus and Grafana).

Tuesday, August 31, 2021

Netdev 0x15


The recent Netdev 0x15 conference included a number of papers diving into the technology behind Linux as a network operating system. Slides and videos are now available on the conference web site.
Network wide visibility with Linux networking and sFlow describes the Linux switchdev driver used to integrate network hardware with Linux. The talk focuses on network telemetry, showing how standard Linux APIs are used to configure hardware instrumentation and stream telemetry using the industry standard sFlow protocol for data center wide visibility.
Switchdev in the wild describes Yandex's experience of deploying Linux switchdev based switches in production at scale. The diagram from the talk shows the three layer leaf and spine network architecture used in their data centers. Yandex operates multiple data centers, each containing up to 100,000 servers.
Switchdev Offload Workshop provides updates about the latest developments in the switchdev community. 
FRR Workshop discusses the latest development in the FRRouting project, the open source routing software that is now a defacto standard on Linux network operating systems.

Wednesday, August 18, 2021

Nokia Service Router Linux


Nokia Service Router Linux (SR-Linux) is an open source network operating system running on Nokia's merchant silicon based data center switches.

The following commands configure SR-Linux to sample packets at 1-in-10000, poll counters every 20 seconds and stream standard sFlow telemetry to an analyzer (192.168.10.20) using the default sFlow port 6343:

system {
    sflow {
        admin-state enable
        sample-rate 10000
        collector 1 {
            collector-address 192.168.10.20
            network-instance default
            source-address 192.168.1.1
            port 6343
        }
    }
}

For each interface:

interface ethernet-1/1 {
    admin-state enable
    sflow {
        admin-state enable
    }
}

Enable sFlow on all switches and ports in the data center fabric for comprehensive visibility.

An instance of the sFlow-RT real-time analytics software converts the raw sFlow telemetry into actionable measurements to drive operational dashboards and automation (e.g. DDoS mitigation, traffic engineering, etc.).
docker run --name sflow-rt -p 8008:8008 -p 6343:6343/udp -d sflow/prometheus
A simple way to get started is to run the Docker sflow/prometheus image on the sFlow analyzer host (192.168.10.20 in the example config) to run sFlow-RT with useful applications to explore the telemetry. Access the web interface at http://192.168.10.20:8008.

Tuesday, June 15, 2021

DDoS mitigation using a Linux switch

Linux as a network operating system describes the benefits of using standard Linux as a network operating system for hardware switches. A key benefit is that the behavior of the physical network can be efficiently emulated using standard Linux virtual machines and/or containers.

In this article, CONTAINERlab will be used to create a simple testbed that can be used to develop a real-time DDoS mitigation controller. This solution is highly scaleable. Each hardware switch can monitor and filter terabits per second of traffic and a single controller instance can monitor and control hundreds of switches.

Create test network

The following ddos.yml file specifies the testbed topology (shown in the screen shot at the top of this article):

name: ddos
topology:
  nodes:
    router:
      kind: linux
      image: sflow/frr
    attacker:
      kind: linux
      image: sflow/hping3
    victim:
      kind: linux
      image: alpine:latest
  links:
    - endpoints: ["router:swp1","attacker:eth1"]
    - endpoints: ["router:swp2","victim:eth1"]

Run the following command to run the emulation:

sudo containerlab deploy ddos.yml

Configure interfaces on router:

interface swp1
 ip address 192.168.1.1/24
!
interface swp2
 ip address 192.168.2.1/24
!

Configure attacker interface:

ip addr add 192.168.1.2/24 dev eth1
ip route add 192.168.2.0/24 via 192.168.1.1

Configure victim interface:

ip addr add 192.168.2.2/24 dev eth1
ip route add 192.168.1.0/24 via 192.168.2.1

Verify connectivity between the attacker and the victim:

sudo docker exec -it clab-ddos-attacker ping 192.168.2.2
PING 192.168.2.1 (192.168.2.1): 56 data bytes
64 bytes from 192.168.2.1: seq=0 ttl=64 time=0.069 ms

Install visibility and control applications on router

The advantage of using Linux as a network operating system is that you can develop and install software to tailor the network to address specific requirements. In this case, for DDoS mitigation, we need real-time visibility to detect DDoS attacks and real-time control to filter out the attack traffic.

Open a shell on router:

sudo docker exec -it clab-ddos-router sh

Install and configure Host sFlow agent:

apk --update add build-base linux-headers openssl-dev dbus-dev gcc git
git clone https://github.com/sflow/host-sflow.git
cd host-sflow
make FEATURES="DENT"
make install

Edit /etc/hsflowd.conf

sflow {
  agent = eth0
  collector { ip=172.20.20.1 udpport=6343 }
  dent { sw=on switchport=swp.* }
}

Note: On a hardware switch, set sw=off to offload packet sampling to hardware.

Start hsflowd:

hsflowd

Download and run tc_server Python script for adding and removing tc flower filters using a REST API:

wget https://raw.githubusercontent.com/sflow-rt/tc_server/master/tc_server
nohup python3 tc_server > /dev/null &

The following command shows the Linux tc filters used in this example:

# tc filter show dev swp1 ingress
filter protocol all pref 1 matchall chain 0 
filter protocol all pref 1 matchall chain 0 handle 0x1 
  not_in_hw
	action order 1: sample rate 1/10000 group 1 trunc_size 128 continue
	 index 3 ref 1 bind 1

filter protocol ip pref 14 flower chain 0 
filter protocol ip pref 14 flower chain 0 handle 0x1 
  eth_type ipv4
  ip_proto udp
  dst_ip 192.168.2.2
  src_port 53
  not_in_hw
	action order 1: gact action drop
	 random type none pass val 0
	 index 1 ref 1 bind 1

The output shows the standard Linux tc-matchall and tc-flower filters used to monitor and drop traffic on the router. The Host sFlow agent automatically installs a matchall rule on each interface in order to sample packets. The tc_server script adds and removes a flower filters to drop unwanted traffic. On a hardware router, the filters are offloaded by the Linux switchdev driver to the router ASIC for line rate performance.

Test REST API

Add filter:

curl -X PUT -H "Content-Type: application/json" \
--data '{"ip_proto":"udp","dst_ip":"10.0.2.2","src_port":"53"}' \
http://clab-ddos-router:8081/swp1/10

Show filters:

curl http://clab-ddos-router:8081/swp1

Remove filter:

curl -X DELETE http://clab-ddos-router:8081/swp1/10

Build an automated DDoS mitigation controller

The following sFlow-RT ddos.js script automatically detects and drops UDP amplification attacks:

var block_minutes = 1;
var thresh = 10000;

setFlow('udp_target',{keys:'ipdestination,udpsourceport',value:'frames'});

setThreshold('attack',{metric:'udp_target', value:thresh, byFlow:true, timeout:2});

var id = 10;
var controls = {};
setEventHandler(function(evt) {
  var key = evt.flowKey;
  if(controls[key]) return;

  var prt = ifName(evt.agent,evt.dataSource);
  if(!prt) return;

  var [dst_ip,src_port] = key.split(',');
  var filter = {
    // uncomment following line for hardware routers
    // 'skip_sw':'skip_sw',
    'ip_proto':'udp',
    'dst_ip':dst_ip,
    'src_port':src_port
  };
  var url = 'http://'+evt.agent+':8081/'+prt+'/'+id++;
  try {
    http(url,'put','application/json',JSON.stringify(filter));
  } catch(e) {
    logWarning(url + ' put failed');
  }
  controls[key] = {time:evt.timestamp, evt:evt, url:url};
  logInfo('block ' + evt.flowKey);
},['attack']);

setIntervalHandler(function(now) {
  for(var key in controls) {
    var control = controls[key];
    if(now - control.time < 1000 * 60 * block_minutes) continue;
    var evt = control.evt;
    if(thresholdTriggered(evt.thresholdID,evt.agent,evt.dataSource+'.'+evt.metric,evt.flowKey)) {
      // attack is ongoing - keep control
      continue;
    }
    try {
      http(control.url,'delete');
    } catch(e) {
      logWarning(control.url + ' delete failed');
    }
    delete controls[key];
    logInfo('allow '+control.evt.flowKey);
  }
});

See Writing Applications for more information on the script.

Run the controller script on the CONTAINERlab host using the sFlow-RT real-time analytics engine:

sudo docker run --network=host -v $PWD/ddos.js:/sflow-rt/ddos.js \
sflow/prometheus -Dscript.file=ddos.js

Verify that sFlow is being received by the checking the sFlow-RT status page, http://containerlab_ip:8008/

Test controller

Monitor for attack traffic on the victim:

sudo docker exec -it clab-ddos-victim sh
apk --update add tcpdump
tcpdump -n -i eth1 udp port 53

Start attack:

sudo docker exec -it clab-ddos-attacker \
hping3 --flood --udp -k -s 53 --rand-source 192.168.2.2

There should be a brief flurry of packets seen at the victim before the controller detects and blocks the attack. The entire period between launching the attack and the attack traffic being blocked is under a second.

Thursday, May 20, 2021

Linux as a network operating system


NVIDIA Linux Switch enables any standard Linux distribution to be used as the operating system on the NVIDIA Spectrum™ switches. Unlike network operating systems that are Linux based, where you are limited to a specific version of Linux and control of the hardware is restricted to vendor specific software modules, Linux Switch allows you to install an unmodified version of your favorite Linux distribution along with familiar Linux monitoring and orchestration tools. 

The key to giving Linux control of the switch hardware is the switchdev module - a standard part of recent Linux kernels. Linux switchdev is an in-kernel driver model for switch devices which offload the forwarding (data) plane from the kernel. Integrating switch ASIC drivers in the Linux kernel makes switch ports appear as additional Linux network interfaces that can be configured and managed using standard Linux tools.

The mlxsw wiki provides instructions for installing Linux using ONIE or PXE boot on Mellanox switch hardware, for example, on NVIDIA® Spectrum®-3 based SN4000 series switches, providing 1G - 400G port speeds to handle scale-out data center applications.

Major benefits of using standard Linux as the switch operating system include:

  • no licensing fees, feature restrictions, or license management complexity associated proprietary network operating systems
  • large ecosystem of open source and commercial software available for Linux
  • software updates and security patches available through Linux distribution
  • install same Linux distribution on the switches and servers to reduce operational complexity and leverage existing expertise
  • run instances of the Linux distribution as virtual machines or containers to test configurations and develop automation scripts
  • standard Linux APIs, and availability of Linux developers, lowers the barrier to customization, making it possible to tailor network behavior to address application / business requirements

The switchdev driver for NVIDIA Spectrum ASICs exposes advanced dataplane instrumentation through standard Linux APIs. This article will explore how the open source Host sFlow agent uses the standard Linux APIs to stream real-time telemetry from the ASIC using industry standard sFlow.

The diagram shows the elements of the solution. Host sFlow agents installed on servers and switches stream sFlow telemetry to an instance of the sFlow-RT real-time analytics engine. The analytics provide a comprehensive, up to the second, view of performance to drive automation.

Note: If you are unfamiliar with sFlow, or want to hear about the latest developments, Real-time network telemetry for automation provides an overview and includes a demonstration of monitoring and troubleshooting network and system performance of a GPU cluster.

Download the latest Host sFlow agent sources:

git clone https://github.com/sflow/host-sflow.git

INSTALL.Linux provides information on compiling Host sFlow on Linux. The following instructions assume a DEB based distrubution (Debian, Ubuntu):

cd host-sflow/
make deb FEATURES=DENT

It isn't necessary to install development tools on the switch. All major Linux distributions are available as Docker images. Select a Docker image that matches the operating system version on the switch and use it to build the package.

Copy the resulting hsflowd package to the switch and install:

sudo dpkg -i hsflowd_2.0.34-3_amd64.deb

Next, edit the /etc/hsflowd.conf file to configure the agent:

sflow {
  collector { ip=10.0.0.1 }
  systemd { }
  psample { group=1 egress=on }
  dropmon { group=1 start=on sw=off hw=on }
  dent { sw=off switchport=swp.* }
}

In this case, 10.0.0.1 is the address of the sFlow collector and swp.* is a regular expression used to identify front panel switch ports. The systemd{} module monitors services running on the switch - see Monitoring Linux services, the psample{} module receives randomly sampled packets from the switch ASIC - see Linux 4.11 kernel extends packet sampling support, the dropmon{} module receives dropped packet notifications - see Using sFlow to monitor dropped packets, and the dent{} module automaticallly configures packet sampling of traffic on front panel switch ports - see Packet Sampling.

Note: The same configuration file can be used for for every switch in the network, making configuration of the agents easy to automate. 

Enable and start the agent.

sudo systemctl enable hsflowd.service
sudo systemctl start hsflowd.service

Finally, use the pre-built sflow/prometheus Docker image to start a copy the sFlow-RT real-time analytics software on the collector host (10.0.0.1):

docker run -p 8008:8008 -p 6343:6343/udp -d sflow/prometheus

The web interface is accessible on port 8008.

The included Metric Browser application lets you explore the metrics that are being streamed. The chart update in real-time as data arrives and in this case identifies the interface in the network with the greatest utilization. The standard set of metrics exported by the Host sFlow agent include interface counters as well as host cpu, memory, disk and service performance metrics. Metrics lists the set of available metrics.

The included Flow Browser application provides an up to the second view traffic flows. Defining Flows describes the fields that can be used to break out traffic. 

Note: The NVIDIA Spectrum 2/3 ASIC includes packet transit delay, selected queue and queue depth with each sampled packet. This information is delivered via the Linux PSAMPLE netlink channel to the Host sFlow agent and included in the sFlow telemetry. These fields are accessible when defining flows in sFlow-RT. See Transit delay and queueing for details.

The included Discard Browser is used to explore packets that are being dropped in the network.

Note: The NVIDIA Spectrum 2/3 ASIC includes instrumentation to capture dropped packets and the reason they were dropped. The information is delivered via the Linux drop_monitor netlink channel to the Host sFlow agent and included in the sFlow telemetry. See Real-time trending of dropped packets for more information.

The included Prometheus application exports metrics to the Prometheus time series database where they can be used to drive Grafana dashboards (e.g. sFlow-RT Countries and Networks, sFlow-RT Health, and sFlow-RT Network Interfaces).

Linux as a network operating system is an exciting advancement if you are interested in simplifying network and system management. Using the Linux networking APIs as a common abstraction layer on servers and switches makes it possible to manage network and compute infrastructure as a unified system.

Thursday, November 19, 2020

Multipass

Multipass is a command line tool for running Ubuntu virtual machines on Mac or Windows. Multipass uses the native virtualization capabilities of the host operating system to simplify the creation of virtual machines.

Docker testbed and Docker DDoS testbed describe how to use containers to experiment with network visibility and control. However, not all software is amenable to running in containers, and so the ability to quickly create and configure virtual machines is a useful complement. This article demonstrates how to use Multipass to quickly build a virtual machine to run Mininet network emulation software.
multipass launch --name=mininet bionic
multipass exec mininet -- sudo apt update
multipass exec mininet -- sudo apt -y install mininet python-ryu
multipass exec mininet -- sudo apt -y install default-jre python-requests hping3
multipass exec mininet -- wget https://inmon.com/products/sFlow-RT/java11/sflow-rt.tar.gz
multipass exec mininet -- tar -xzf sflow-rt.tar.gz
multipass exec mininet -- ./sflow-rt/get-app.sh sflow-rt mininet-dashboard

Run the above commands in a terminal to create the virtual machine. Multipass commands can easily be scripted to automate the creation and configuration of virtual machines.

multipass list
List the virtual machines.
Name                    State             IPv4             Image
test                    Running           192.168.64.2     Ubuntu 18.04 LTS

Find the IP address of the mininet virtual machine we just created (192.168.64.2).

multipass exec mininet -- ./sflow-rt/start.sh

Start sFlow-RT.

Use a web browser to connect to the VM and access the Mininet Dashboard application running on sFlow-RT, in this case http://192.168.64.2:8008/app/mininet-dashboard/html/
multipass exec mininet -- sudo mn --custom sflow-rt/extras/sflow.py \
--link tc,bw=10 --topo tree,depth=2,fanout=2 --test iperf
In a separate terminal, run a test using Mininet.
The Mininet Dashboard shows the test traffic, the links in the emulated network carrying the traffic, and the diameter of the emulated network.
The Topology tab shows a Mininet weathermap, displaying a dynamic view of topology in which link widths update in real-time to reflect traffic flowing over the virtual network.

An external SDN controller can be used to control packet forwarding in the network.
multipass exec mininet -- ryu-manager ryu.app.simple_switch,ryu.app.ofctl_rest
Start the Ryu SDN controller in a terminal window.
multipass exec mininet -- sudo mn --custom sflow-rt/extras/sflow.py \
--link tc,bw=10 --topo tree,depth=2,fanout=2 \
--controller=remote,ip=127.0.0.1 --test iperf
Run the same test as before, but this time connecting to the SDN controller. For a more interesting example, Ryu measurement based control describes how to detect and block denial of service attacks using the controller.

There are additional multipass commands available to manage the virtual machine.
multipass shell mininet
Connect to the virtual machine and access a command shell.
multipass stop mininet
Stop the virtual machine.
multipass start mininet
Start the virtual machine.
multipass delete mininet
multipass purge
Delete the virtual machine.

There are a number of Mininet articles on this blog describing projects that can be run using the virtual machine that demonstrate performance aware software defined networking concepts.

Wednesday, November 11, 2020

DENT


Introducing DENT OS, switchdev NOS for the rest of us talk, presented at the recent Open Source Summit, describes the Linux Foundation DENT project. The slides from the presentation are available.

Linux switchdev is an in-kernel driver model for switch devices which offload the forwarding (data) plane from the kernel. Integrating switch ASIC drivers in the Linux kernel makes switch ports appear as additional Linux network interfaces that can be configured and managed using standard Linux tools. 

DENT is an Ubuntu based Linux distribution that packages the drivers for switch hardware (fans, temperature sensors, ASIC, etc) along with the open source FRRouting routing protocol suite which includes protocol daemons for BGP, IS-IS, LDP, OSPF, PIM, and RIP. The FRRouting software uses the Linux netlink API to program Linux kernel packet forwarding, which on a hardware switch platform is offloaded by the switchdev driver to the ASIC for line rate forwarding.

A major benefit of DENT's approach to making Linux into the network operating system is that the same tools used to configure, manage and monitor Linux servers can also be used to manage network switches. In addition, a DENT virtual machine behaves in exactly the same way as DENT running on a physical switch, allowing configurations to be validated in virtual environments before being pushed into the production network.

The open source Host sFlow agent streams standard sFlow telemetry from Linux hosts. On a switchdev based network switch, hardware counters are gathered using standard Linux API's for monitoring network interfaces. The Host sFlow agent also supports Linux psample and drop_monitor APIs that provide visibility into packet flows and dropped packets. On hardware switches, the switchdev driver offloads these measurements to the switch ASIC which provides line rate visibility into packet forwarding. 
Installing Host sFlow agents on DENT OS based switches activates the standard sFlow hardware instrumentation in switch ASICs to stream network telemetry to an sFlow collector, for example sFlow-RT, for the real-time network-wide view of performance needed to drive automation.

Tuesday, September 8, 2020

Cumulus Linux 4.2

Cumulus Linux is a network operating system for open networking hardware. Cumulus VX is a free virtual appliance that allows network engineers to experiment with Cumulus Linux and verify configurations before deploying into production. 
The Cumulus VX documentation describes how to build network topologies in KVM, VirtualBox, using VMWare hypervisors. If you want to run virtual machines locally, Cumulus in the Cloud is a free service that will allow you to access pre-built networks in the public cloud.

A key feature of Cumulus Linux is the use of the Linux kernel as the authoritative repository of network state. A result of this approach is that the behavior of a Cumulus Linux VX virtual appliance is the same as Cumulus Linux running on a hardware switch. For example, the open source FRR routing daemon shipped with Cumulus Linux uses the Linux netlink API to push routes to the kernel, which forwards packets in the virtual appliance. On a physical switch, routes are still pushed to the kernel, but kernel routing configuration is then offloaded to the switch ASIC so that packets bypass the kernel and are routed by hardware.

Cumulus Linux includes the open source Host sFlow agent. Here again, standard Linux APIs are used to implement sFlow packet sampling (see Linux 4.11 kernel extends packet sampling support). On the virtual appliance, packet sampling is performed by the Linux kernel. On a hardware switch packet sampling is offloaded to the switch ASIC. In both cases streaming sFlow telemetry provides visibility into packet forwarding.

This article demonstrates how to configure and enable sFlow Cumulus Linux (see Monitoring System Statistics and Network Traffic with sFlow). If you don't have access to a switch, download Cumulus VX to follow the example.

First log into the switch.
ssh cumulus@leaf01
Next, edit configuration file:
sudo vi /etc/hsflowd.conf
Change the following configuration setting to send sFlow to a collector at address 10.0.0.30:
sflow {
...
  collector { ip=10.0.0.30 }
...
}
Start the hsflowd daemon:
sudo systemctl enable hsflowd@mgmt.service
sudo systemctl start hsflowd@mgmt.service
In this case the collector is on the out of band management network and so the daemon needs to run in the management VRF (see Management VRF).

Use the following commands instead to send sFlow to an in-band collector on the default VRF:
sudo systemctl enable hsflowd.service
sudo systemctl start hsflowd.service
Note: Automating sFlow configuration is straightforward since the configurations are not switch specific so that every switch in the network can be given the same configuration.

Docker Desktop provides a convenient method of running sFlow analytics software on the collector machine (10.0.0.30).
docker run --rm -p 6343:6343/udp sflow/sflowtool
Use the sflow/sflowtool image to verify that sFlow telemetry is being received.
docker run --rm -p 8008:8008 -p 6343:6343/udp sflow/prometheus
Use the sflow/prometheus image to run the sFlow-RT real-time analyzer packaged with tools to browse flows and metrics and export data to Prometheus and Grafana (see sFlow-RT Network Interfaces, sFlow-RT Countries and Networks, and sFlow-RT Health dashboards for examples). Open the URL http://localhost:8008/ to access the web interface.

RESTful control of Cumulus Linux ACLs describes an open source extension to the Cumulus Linux REST API that has been used to automate control actions based on real-time traffic analytics: Triggered remote packet capture using filtered ERSPAN and DDoS mitigation with Cumulus Linux.

Cumulus VX provides a convenient platform for developing and testing monitoring and control strategies before deploying them into a production network. The consistency between the behavior of the Cumulus VX virtual appliance and Cumulus Linux running on a physical switch assures a seamless transition.

Tuesday, August 11, 2020

Real-time trending of dropped packets

Discard Browser is a recently released open source application running on the sFlow-RT real-time analytics engine. The software uses streaming analytics to trend dropped packets.
Using sFlow to monitor dropped packets describes the recently added packet drop monitoring functionality added to the open source Host sFlow agent. The article describes how to install and configure the agent on Linux-based platforms and stream industry standard sFlow telemetry to an sFlow collector.

Visibility into dropped packets describes instrumentation, recently added to the Linux kernel, that provides visibility into packets dropped by the kernel data path on a host, or dropped by a switch ASIC when packets are forwarded in hardware.  Extending sFlow to provide visibility into dropped packets offers significant benefits for network troubleshooting, providing real-time network-wide visibility into the specific packets that were dropped as well the reason the packet was dropped. This visibility instantly reveals the root cause of drops and the impacted connections.

Packet discard monitoring complements sFlow's existing counter polling and packet sampling mechanisms and shares a common data model so that all three sources of data can be correlated.  For example, if packets are being discarded because of buffer exhaustion, the discard records don't necessarily tell the whole story. The discarded packets may represent mice flows that are victims of an elephant flow. Packet samples will reveal the traffic that isn't being dropped and provide a more complete picture. Counter data adds additional information such as CPU load, interface speed, link utilization, packet and discard rates that further completes the picture.

A simple way to run Discard Browser, pre-packaged with sFlow-RT collector, is to use the Docker sflow/prometheus image:
docker run --rm -p 6343:6343/udp -p 8008:8008 sflow/prometheus
Access the web interface at http://localhost:8008/.

The screen shot at the top of the page shows dropped connection attempts to the Linux host running the sFlow agent. The connection attempt were generated using curl:
curl http://192.168.1.87:8080
The Docker image also includes Metric Browser and Flow Browser applications that allow the full range of sFlow telemetry to be explored - see Real-time network and system metrics as a service for examples.

The included Prometheus exporter allows data to be pulled into a time series database to be included in dashboards. The Grafana sFlow-RT Network Interfaces, sFlow-RT Countries and Networks, sFlow-RT DDoS Protect, and sFlow-RT Health dashboards provide examples.

Friday, July 31, 2020

Using sFlow to monitor dropped packets

Visibility into dropped packets describes instrumentation, recently added to the Linux kernel, that provides visibility into packets dropped by the kernel data path on a host, or dropped by a switch ASIC when packets are forwarded in hardware. This article describes integration of drop monitoring in the open source Host sFlow agent and inclusion of drop reporting as part of industry standard sFlow telemetry.

Extending sFlow to provide visibility into dropped packets offers significant benefits for network troubleshooting, providing real-time network-wide visibility into the specific packets that were dropped as well the reason the packet was dropped. This visibility instantly reveals the root cause of drops and the impacted connections.

Packet discard monitoring complements sFlow's existing counter polling and packet sampling mechanisms and shares a common data model so that all three sources of data can be correlated.  For example, if packets are being discarded because of buffer exhaustion, the discard records don't necessarily tell the whole story. The discarded packets may represent mice flows that are victims of an elephant flow. Packet samples will reveal the traffic that isn't being dropped and provide a more complete picture. Counter data adds additional information such as CPU load, interface speed, link utilization, packet and discard rates that further completes the picture.

The following steps build the Host sFlow agent with drop monitoring on an Ubuntu 20 system (a Linux 5.4 kernel or newer is required):
git clone https://github.com/sflow/host-sflow
cd host-sflow
make FEATURES="HOST PCAP DROPMON"
sudo make install
sudo make schedule
Next, edit the /etc/hsflowd.conf file, in this example, directing sFlow to be sent to a collector at 192.168.1.242, enabling packet sampling on host adapter enp0s3, and enabling drop monitoring:
sflow {
  collector { ip=192.168.1.242 }
  pcap { dev = enp0s3 }
  dropmon { group = 1 start = on }
}
Start the agent:
sudu systemctl enable hsflowd
sudo systemctl start hsflowd
Build the latest version of sflowtool on the collector host (192.168.1.242):
git clone https://github.com/sflow/sflowtool
cd sflowtool
./boot.sh
./configure
make
sudo make install
Now run sflowtool to receive and decode the sFlow telemetry stream:
sflowtool
The following example shows the output for a discarded TCP packet:
startSample ----------------------
sampleType_tag 0:5
sampleType DISCARD
sampleSequenceNo 20
sourceId 0:1
dropEvents 0
inputPort 1
outputPort 0
discardCode 289
discardReason unknown_l4
discarded_flowBlock_tag 0:1
discarded_flowSampleType HEADER
discarded_headerProtocol 1
discarded_sampledPacketSize 54
discarded_strippedBytes 0
discarded_headerLen 54
discarded_headerBytes 00-00-00-00-00-00-00-00-00-00-00-00-08-00-45-00-00-28-00-00-40-00-40-06-3C-CE-7F-00-00-01-7F-00-00-01-04-05-04-39-00-00-00-00-14-51-E2-8A-50-14-00-00-B2-B4-00-00
discarded_dstMAC 000000000000
discarded_srcMAC 000000000000
discarded_IPSize 40
discarded_ip.tot_len 40
discarded_srcIP 127.0.0.1
discarded_dstIP 127.0.0.1
discarded_IPProtocol 6
discarded_IPTOS 0
discarded_IPTTL 64
discarded_IPID 0
discarded_TCPSrcPort 1029
discarded_TCPDstPort 1081
discarded_TCPFlags 20
endSample   ----------------------
The sflowtool -T option converts the discarded packet records into PCAP format so that they can be decoded by packet analysis tools such as Wireshark and tcpdump:
sflowtool -T | tshark -r -
   12  22.000000 192.168.1.242 → 192.168.1.87 TCP 78 65527 → 80 [SYN] Seq=0 Win=65535 Len=0 MSS=1460 WS=64 TSval=1324841769 TSecr=0 SACK_PERM=1
The article sFlow to JSON uses Python examples to demonstrate how sflowtool's ability to convert sFlow records into JSON can be used for further analysis.