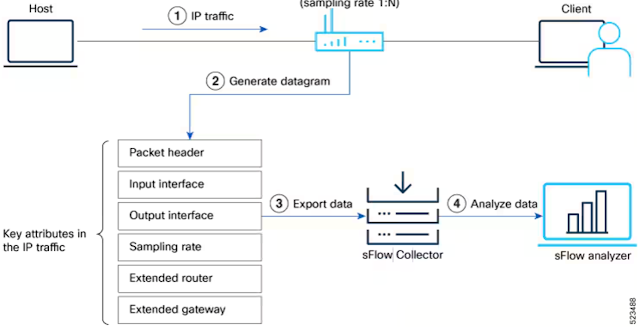
The availability of the Cisco IOS XR Release 25.1.1 brings sFlow dropped packet notification support to Cisco 8000 series routers, making it easy to capture and analyze packets dropped at router ingress, aiding in understanding blocked traffic types, identifying potential security threats, and optimizing network performance.
sFlow Configuration for Traffic Monitoring and Analysis describes the steps to enable sFlow and configure packet sampling and interface counter export from a Cisco 8000 Series router to a remote sFlow analyzer.
Note: Devices using NetFlow or IPFIX must transition to sFlow for regular sampling before utilizing the dropped packet feature, ensuring compatibility and consistency in data analysis.
Router(config)#monitor-session monitor1
Router(config)#destination sflow EXP-MAP
Router(config)#forward-drops rx
Configure a monitor-session with the new destination sflow option to export dropped packet notifications (which include ingress interface, drop reason, and header of dropped packet) to the configured sFlow analyzer.
Cisco lists the following benefits of streaming dropped packets in the configuration guide:
- Enhanced Network Visibility: Captures and forwards dropped packets to an sFlow collector, providing detailed insights into packet loss and improving diagnostic capabilities.
- Comprehensive Analysis: Allows for simultaneous analysis of regular and dropped packet flows, offering a holistic view of network performance.
- Troubleshooting: Empowers network administrators to effectively identify and resolve issues, reducing downtime and enhancing overall network reliability.
The following two use cases illustrate these points:
DDoS Mitigation with Cisco, sFlow, and BGP Flowspec describes how to configure sFlow and BGP on a Cisco 8000 series router to automatically detect and filter DDoS attacks. Adding visibility into dropped packets confirms that attack traffic is being dropped and provides details of the dropped packets that can be used to further characterize the attack and mitigate any collateral damage caused by the filters.
Note: The browse-drops application included with DDoS controller can be used to interactively examine the dropped packets in real-time and Flow metrics with Prometheus and Grafana and Dropped packet metrics with Prometheus and Grafana describe how to record metrics in a time series database for use in operational dashboards.
Comparing AI / ML activity from two production networks demonstrates another interesting use case: Visibility into dropped packets is essential for Artificial Intelligence/Machine Learning (AI/ML) workloads, where a single dropped packet can stall large scale computational tasks, idling millions of dollars worth of GPU/CPU resources, and delaying the completion of business critical workloads. Enabling real-time sFlow telemetry provides the observability into traffic flows and packet drops needed to effectively manage these networks.


No comments:
Post a Comment