Friday, November 17, 2023
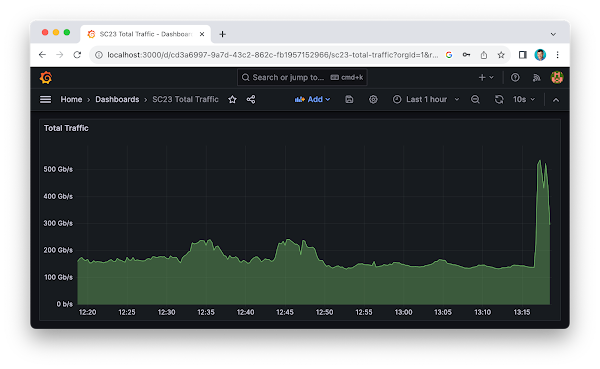
SC23 Over 6 Terabits per Second of WAN Traffic
Thursday, November 16, 2023
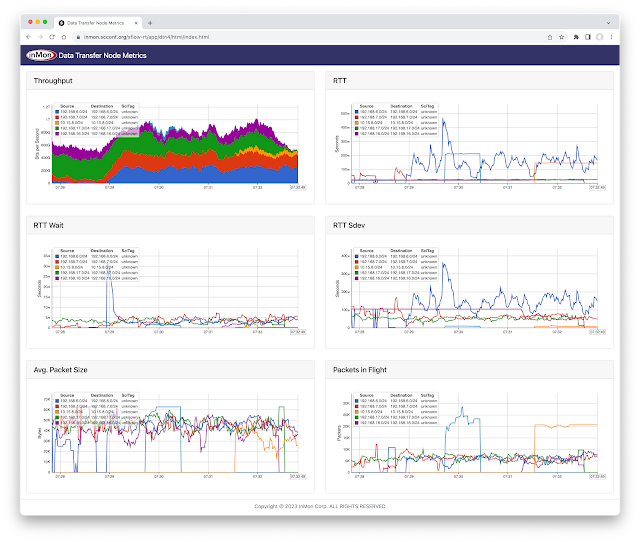
SC23 Data Transfer Node TCP Metrics
The dashboard displays data gathered from open source Host sFlow agents installed on Data Transfer Nodes (DTNs) run by the Caltech High Energy Physics Department and used for handling transfer of large scientific data sets (for example, accessing experiment data from the CERN particle accelerator). Network performance monitoring describes how the Host sFlow agents augment standard sFlow telemetry with measurements that the Linux kernel maintains as part of the normal operation of the TCP protocol stack.
The dashboard shows 5 large flows (greater than 50 Gigabits per Second). For each large flow being tracked, additional TCP performance metrics are displayed:
- RTT The round trip time observed between DTNs
- RTT Wait The amount of time that data waits on sender before it can be sent.
- RTT Sdev The standard deviation on observed RTT. This variation is a measure of jitter.
- Avg. Packet Size The average packet size used to send data.
- Packets in Flight The number of unacknowledged packets.
See Defining Flows for full range of attributes that can be used to create flow metrics.
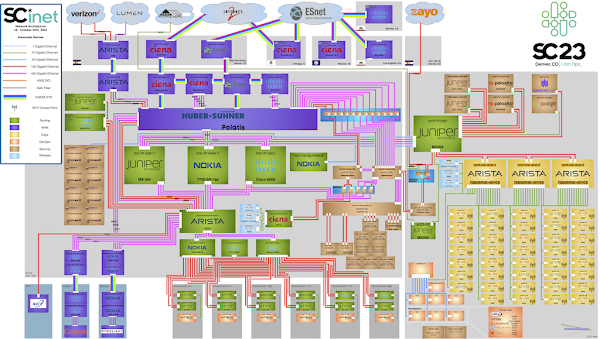
The conference network used in the demonstration, SCinet, is described as the most powerful and advanced network on Earth, connecting the SC community to the world. In this example, the sFlow-RT real-time analytics engine receives sFlow telemetry from switches, routers, and servers in the SCinet network and creates metrics to drive the real-time charts in the dashboard. Getting Started provides a quick introduction to deploying and using sFlow-RT for real-time network-wide flow analytics.Finally, check out the SC23 Dropped packet visibility demonstration, SC23 SCinet traffic, and SC23 WiFi Traffic Heatmap for additional network visibility demonstrations from the show.
Wednesday, November 15, 2023
SC23 WiFi Traffic Heatmap
Additional use cases being demonstrated this week include, SC23 Dropped packet visibility demonstration and SC23 SCinet traffic.
Monday, November 13, 2023
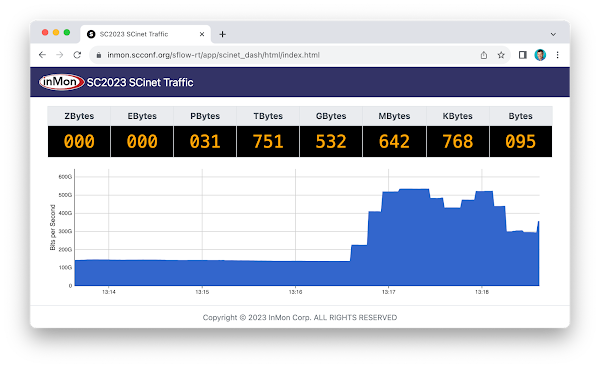
SC23 SCinet traffic
Finally, check out the SC23 Dropped packet visibility demonstration to learn about one of newest developments in sFlow monitoring and see a live demonstration.
Friday, November 10, 2023
SC23 Dropped packet visibility demonstration
The SC23-NRE-026 Standard Packet Drop Monitoring In High Performance Networks dashboard combines telemetry from all the Arista switches in the SCinet network to provide real-time network-wide view of performance. Each of the three charts demonstrate a different type of measurement in the sFlow telemetry stream:
- Counters: Total Traffic shows total traffic calculated from interface counters streamed from all interfaces. Counters provide a useful way of accurately reporting byte, frame, error and discard counters for each network interface. In this case, the chart rolls up data from all interfaces to trend total traffic on the network.
- Samples: Top Flows shows the top 5 largest traffic flows traversing the network. The chart is based on sFlow's random packet sampling mechanism, providing a scaleable method of determining the hosts and services responsible for the traffic reported by the counters. Visibility into top flows is essential if one wants to take action to manage network usage and capacity: immediately identifying DDoS attacks, elephant flows, and tracking changing service demands.
Note: Network addresses have been masked for privacy. - Notifications: Dropped Packets shows each dropped packet, the device that dropped it, and the reason it was dropped. Dropped packets have a profound impact on network performance and availability. Packet discards due to congestion can significantly impact application performance. Dropped packets due to black hole routes, expired TTLs, MTU mismatches, etc can result in insidious connection failures that are time consuming and difficult to diagnose.
Note: Network addresses have been masked for privacy.
sflow sampling 50000
sflow polling-interval 20
sflow vrf mgmt destination 2001:XXX:XXX:XXXX::XXX
sflow vrf mgmt source-interface Management0
sflow extension bgp
sflow run
The above Arista EOS commands enable sFlow counter polling and packet sampling on all ports, sending the sFlow telemetry to the sFlow analyzer at 2001:XXX:XXX:XXXX::XXX (IPv6 address masked for privacy).
flow tracking mirror-on-drop
  sample limit 100 pps
  !
  tracker SC23
    exporter SC23
      format sflow
      collector sflow
      local interface Management0
  no shutdown
The above commands add sFlow Dropped Packet Notification Structures to the sFlow telemetry feed. EOS 4.30.1f on Jericho 2 platforms (e.g. Arista 7804r3 at the core of SCinet diagram) is required since the implementation is based on Broadcom Mirror on Drop (MoD) instrumentation. Broadcom implements mirror-on-drop in Jericho 2, Trident 3, and Tomahawk 3, or later ASICs so it should be possible for Arista to release broad support across products incorporating these ASICs.
In this example, the sFlow-RT real-time analytics engine receives sFlow telemetry from switches, routers, and servers in the SCinet network and create metrics to drive the real-time charts in the dashboard. Getting Started provides a quick introduction to deploying and using sFlow-RT for real-time network-wide flow analytics. The demonstration dashboard only scratches the surface of the detailed visibility that is possible analyzing the packet headers exported in sFlow packet samples and dropped packet notifications - see Defining Flows.
The dashboard above trends Total Packet Rate and Dropped Packet Rate by Reason. The dashboard was constructed using the Prometheus time series database to store metrics retrieved from sFlow-RT and Grafana to build the dashboard. Deploy real-time network dashboards using Docker compose demonstrates how to deploy and configure these tools to create custom dashboards like the one shown here.
Industry standard sFlow telemetry is widely supported by data center switch vendors and provides the scaleable real-time visibility needed to understand and manage traffic in high performance networks. The open source Host sFlow agent extends visibility onto servers to ensure end-to-end visibility.
Visibility into dropped packets is essential for Artificial Intelligence/Machine Learning (AI/ML) workloads, where a single dropped packet can stall large scale computational tasks, idling millions of dollars worth of GPU/CPU resources, and delaying the completion of business critical workloads. Enable real-time sFlow telemetry to provide the observability needed to effectively manage these networks.
Thursday, October 5, 2023
Internet eXchange Provider (IXP) Metrics
IXP Metrics is available on Github. The application provides real-time monitoring of traffic between members of an Internet eXchange Provider (IXP) network.
This article will use Arista switches as an example to illustrate the steps needed to deploy the monitoring solution, however, these steps should work for other network equipment vendors (provided you modify the vendor specific elements in this example).
git clone https://github.com/sflow-rt/prometheus-grafana.git
sed -i -e 's/prometheus/ixp-metrics/g' prometheus-grafana/env_vars
./prometheus-grafana/start.sh
The easiest way to get started is to use Docker, see Deploy real-time network dashboards using Docker compose, and deploy the sflow/ixp-metrics image bundling the IXP Metrics application.
scrape_configs:
  - job_name: sflow-rt-ixp-metrics
    metrics_path: /app/ixp-metrics/scripts/metrics.js/prometheus/txt
    static_configs:
    - targets: ['sflow-rt:8008']
Follow the directions in the article to add a Prometheus scrape task to retrieve the metrics.
sflow source-interface management 1
sflow destination 10.0.0.50
sflow polling-interval 20
sflow sample 50000
sflow run
Enable sFlow on all exchange switches, directing sFlow telemetry to the Docker host (in this case 10.0.0.50).
Use the sFlow-RT Status page to confirm that sFlow is being received from the switches. In this case 286 sFlow datagrams per second are being received from 9 switches. The IX-F Member Export JSON Schema V1.0 is used to identify exchange members and their assigned MAC addresses. Upload the member data to the IXP Metrics Settings tab. Additional tabs are provided to locate members and MAC addresses to switch ports, query for unauthorized traffic, see real-time charts, etc. Upload an sFlow-RT Topology. In this example, Arista eAPI can be used to query Arista switches and discover the network topology. Use the Topology Status page to verify that sFlow telemetry is being received for all the switches and links in the topology. sFlow-RT IXP Overall Traffic dashboard (ID: 19706) shows overall traffic in and out of exchange, breakdown of IPv4, IPv6 and ARP traffic, packet size distribution, and total number of BGP peering connections across exchange. sFlow-RT IXP Member Traffic Top N dashboard (ID: 19707) shows peering traffic. Select a member and see trends of traffic to / from other members of the exchange. sFlow-RT IXP Traffic Matrix dashboard (ID: 19708) displays a grid view of the traffic exchanged between members across the exchange. Grafana Network Weathermap describes how to construct a real-time dashboard showing network topology and link utilizations.Support for sFlow is a standard in switches used to construct Internet Exchanges. The combination of Docker, sFlow-RT, Prometheus, and Grafana provide a scaleable, cost effective, and flexible method of monitoring traffic and generating real-time dashboards.
Monday, August 14, 2023
Containerlab dashboard
git clone https://github.com/sflow-rt/containerlab.git
cd containerlab
./run-clab
Run the above commands to download the project and run Containerlab on a system with Docker installed. Docker Desktop is a conventient way to run the labs on a laptop.
containerlab deploy -t clos5.ymlStart the emulation.
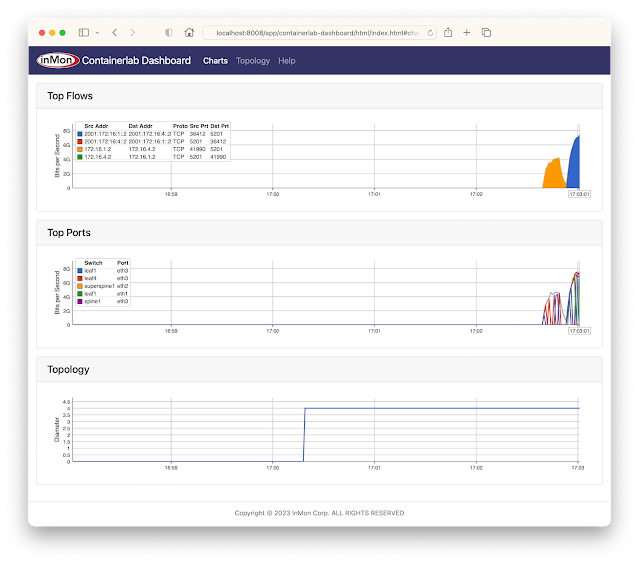
./topo.py clab-clos5Post topology to sFlow-RT REST API. Connect to http://localhost:8008/app/containerlab-dashboard/html/ to access the Dashboard shown at the top of this article.
docker exec -it clab-clos5-h1 iperf3 -c 172.16.4.2Each of the hosts in the network has an iperf3 server, so running the above command will test bandwidth between h1 and h4.
docker exec -it clab-clos5-h1 iperf3 -c 2001:172:16:4::2Generate a large IPv6 flow between h1 and h4. The traffic flows should immediately appear in the Top Flows chart. You can check the accuracy by comparing the values reported by iperf3 with those shown in the chart. Click on the Topology tab to see a real-time weathermap of traffic flowing over the topology. See how repeated iperf3 tests take different ECMP (equal-cost multi-path) routes across the network.
docker exec -it clab-clos5-leaf1 vtyshLinux with open source routing software (FRRouting) is an accessible alternative to vendor routing stacks (no registration / license required, no restriction on copying means you can share images on Docker Hub, no need for virtual machines). FRRouting is popular in production network operating systems (e.g. Cumulus Linux, SONiC, DENT, etc.) and the VTY shell provides an industry standard CLI for configuration, so labs built around FRR allow realistic network configurations to be explored. Connect to http://localhost:8008/ to access the main sFlow-RT status page, additional applications, and the REST API. See Getting Started for more information.
containerlab destroy -t clos5.ymlWhen you are finished, run the above command to stop the containers and free the resources associated with the emulation. Try out other topologies from the project to explore topics such as DDoS mitigation, BGP Flowspec, and EVPN.
Moving the monitoring solution from Containerlab to production is straightforward since sFlow is widely implemented in datacenter equipment from vendors including: A10, Arista, Aruba, Cisco, Edge-Core, Extreme, Huawei, Juniper, NEC, Netgear, Nokia, NVIDIA, Quanta, and ZTE. In addition, the open source Host sFlow agent makes it easy to extend visibility beyond the physical network into the compute infrastructure.
Tuesday, August 8, 2023
Grafana Network Weathermap
Deploy real-time network dashboards using Docker compose, describes how to quickly deploy a real-time network analytics stack that includes the sFlow-RT analytics engine, Prometheus time series database, and Grafana to create dashboards. This article describes how to extend the example using the Grafana Network Weathermap Plugin to display network topologies like the ones shown here.
First, add a dashboard panel and select the Network Weathermap visualization. Next define the three metrics shown above. The ifinoctets and ifoutoctets need to be scaled by 8 to convert from bytes per second to bits per second. Creating a custom legend entry makes it easier to select metrics to associate metric instances with weathermap links. Add a color scale that will be used to color links by link utilization. Defining the scale first ensures that links will be displayed correctly when they are added later. Add the nodes to the canvas and drag them to their desired locations. There is a large library of icons that can be used to indicate the node types. The Enable Node Grid Snapping makes it easier to line up nodes. Add links to connect the nodes. Each link needs to be associated with in/out metrics and and a link speed. Setting the Side Anchor Point values correctly ensures a clean layout.Network weathermaps are only one method of displaying network telemetry - work through the examples in Deploy real-time network dashboards using Docker compose to learn how to construct dashboards of trend charts and analyze traffic flows.
Thursday, July 13, 2023
Deploy real-time network dashboards using Docker compose
This article demonstrates how to use docker compose to quickly deploy a real-time network analytics stack that includes the sFlow-RT analytics engine, Prometheus time series database, and Grafana to create dashboards.
git clone https://github.com/sflow-rt/prometheus-grafana.git
cd prometheus-grafana
./start.sh
Download the sflow-rt/prometheus-grafana project from GitHub on a system with Docker installed and start the containers. The start.sh script runs docker compose to bring up the containers specified in the compose.yml file, passing in user information so that the containers have correct permission to write data files in the prometheus and grafana directories.
All the Docker images in this example are available for both x86 and ARM processors, so this stack can be deployed on Intel/AMD platforms as well as Apple M1/M2 or Raspberry Pi. Raspberry Pi 4 real-time network analytics describes how to configure a Raspberry Pi 4 to run Docker and perform real-time network analytics and is a simple way to run this stack for smaller networks.
Configure sFlow Agents in network devices to stream sFlow telemetry to the host running the analytics stack. See Getting Started for information on how to verify that sFlow telemetry is being received.
Connect to the Grafana web interface on port 3000 using default user name and password (admin/admin). You will be promted to change the password. Select the option to Import a new Dashboard. Enter the code 11201 to import sFlow-RT Network Interfaces dashboard from Grafana.com and click on the Load button. Select the sflow_rt_data Prometheus database and click on the Import button. The dashboard should appear showing top interfaces by Utilization, Discards and Errors. Repeat the steps to add the sFlow-RT Health dashboard, code 11096.The sFlow-RT Countries and Networks dashboard is an example of a flow based metric, plotting information about source and destination countries and provider networks based on traffic analytics.
Prometheus has already been programmed to gather metrics for the previous two example, but to run this third example, we need to modify the Prometheus configuration to gather the flow based metrics needed for the dashboard.
  - job_name: 'sflow-rt-countries'
    metrics_path: /app/prometheus/scripts/export.js/flows/ALL/txt
    static_configs:
      - targets: ['sflow-rt:8008']
    params:
      metric: ['sflow_country_bps']
      key:
        - 'null:[country:ipsource:both]:unknown'
        - 'null:[country:ipdestination:both]:unknown'
      label: ['src','dst']
      value: ['bytes']
      scale: ['8']
      aggMode: ['sum']
      minValue: ['1000']
      maxFlows: ['100']

  - job_name: 'sflow-rt-asns'
    metrics_path: /app/prometheus/scripts/export.js/flows/ALL/txt
    static_configs:
      - targets: ['sflow-rt:8008']
    params:
      metric: ['sflow_asn_bps']
      key:
        - 'null:[asn:ipsource:both]:unknown'
        - 'null:[asn:ipdestination:both]:unknown'
      label: ['src','dst']
      value: ['bytes']
      scale: ['8']
      aggMode: ['sum']
      minValue: ['1000']
      maxFlows: ['100']
Edit the prometheus/prometheus.yml file and add the above lines to the end of the file.
docker restart prometheusRestart the prometheus container to pick up the new configuration and start collecting the data. Add dashboard 11146 to load the sFlow-RT Countries and Networks dashboard.
Getting Started describes how to use the sFlow-RT Flow Browser and Metrics Browser applications to explore the data that is available (the sFlow-RT web interface is exposed on port 8008). Once you have found a useful metric, add it to the set of metrics for Prometheus (the Prometheus web interface is exposed on port 9090) to collect and use Grafana to build dashboards that incorporate the new metrics. Flow metrics with Prometheus and Grafana describes how Prometheus can use sFlow-RT's REST API to define and retrieve traffic flow based metrics like the ones in the Countries and Networks dashboard.
Sunday, June 11, 2023
Raspberry Pi 4 real-time network analytics
 |
| CanaKit Raspberry Pi 4 EXTREME Kit - Aluminum |
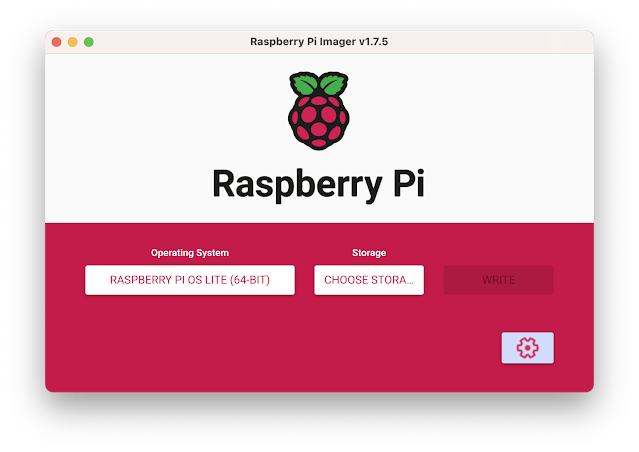
Next, follow instruction for installing Docker Engine (Raspberry Pi OS Lite is based on Debian 11).
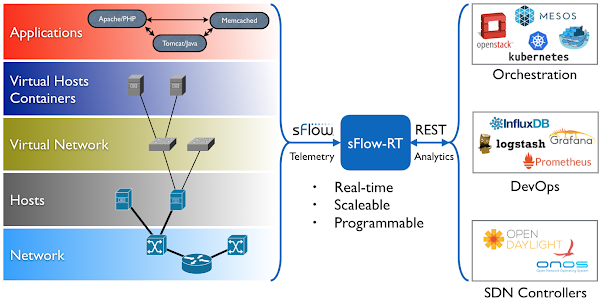
The diagram shows how the sFlow-RT real-time analytics engine receives a continuous telemetry stream from industry standard sFlow instrumentation build into network, server and application infrastructure and delivers analytics through APIs and can easily be integrated with a wide variety of on-site and cloud, orchestration, DevOps and Software Defined Networking (SDN) tools.docker run -p 6343:6343/udp -p 127.0.0.1:8008:8008 \ --name sflow-rt -d --restart unless-stopped sflow/prometheusRun the pre-built sflow/prometheus Docker image. In this example access to the user interface is limited to local host in order prevent unauthorized access since no access controls are provided by sFlow-RT.
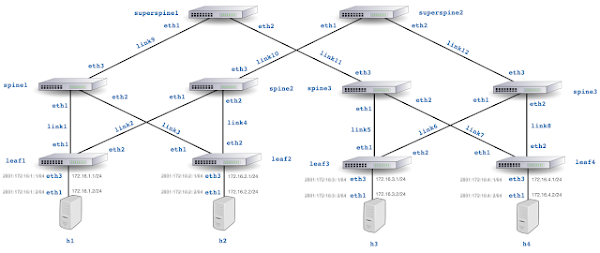
ssh -L 8008:127.0.0.1:8008 pp@192.168.4.163Use ssh to connect to the Raspberry Pi (192.168.4.163) and tunnel port 8008 to your laptop.Access the web interface at http://127.0.0.1:8008/. See Getting Started for instructions for enabling monitoring and browsing metrics. Python is installed by default on Raspberry Pi OS, making it convenient to experiment with the sFlow-RT REST API, see Writing Applications. If you don't have immediate access to a network and want to experiment, follow the instructions in Leaf and spine network emulation on Mac OS M1/M2 systems to emulate the 5 stage leaf and spine network shown above using Containerlab.
docker stop sflow-rtNote: If you are going to try the examples, first run the command above to stop the sflow-rt image to avoid port contention when Containerlab starts an instance of sFlow-RT. The screen capture shows a real-time view of traffic flowing across the the emulated leaf and spine network during a series iperf3 tests. The emulated results are very close to those you can expect when monitoring production traffic on a physical network.
The Raspberry Pi 4 is surprisingly capable, this pocket-sized server can easily monitor hundreds of high speed (100G+) links, providing up to the second visibility into network flows.


