Finally, check out the SC23 Dropped packet visibility demonstration to learn about one of newest developments in sFlow monitoring and see a live demonstration.
Monday, November 13, 2023
SC23 SCinet traffic
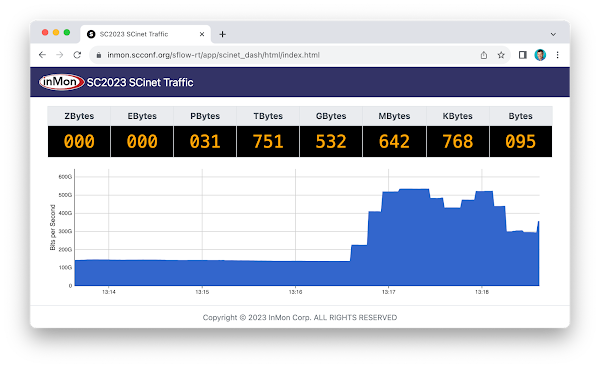
The real-time dashboard shows total network traffic at The International Conference for High Performance Computing, Networking, Storage, and Analysis (SC23) conference being held this week in Denver. The dashboard shows that 31 Petabytes of data have been transferred already and the conference hasn't even started.
The conference network used in the demonstration, SCinet, is described as the most powerful and advanced network on Earth, connecting the SC community to the world.
In this example, the sFlow-RT real-time analytics engine receives sFlow telemetry from switches, routers, and servers in the SCinet network and creates metrics to drive the real-time charts in the dashboard. Getting Started provides a quick introduction to deploying and using sFlow-RT for real-time network-wide flow analytics.
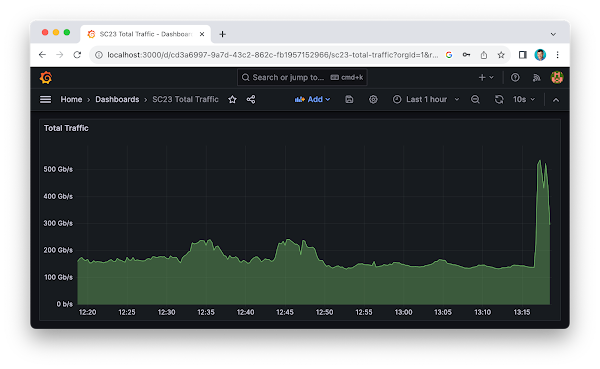
The dashboard above trends SC23 Total Traffic. The dashboard was constructed using the Prometheus time series database to store metrics retrieved from sFlow-RT and Grafana to build the dashboard. Deploy real-time network dashboards using Docker compose demonstrates how to deploy and configure these tools to create custom dashboards like the one shown here.
Labels:
Grafana,
Prometheus,
sFlow,
sFlow-RT,
telemetry,
visibility
Subscribe to:
Post Comments (Atom)


No comments:
Post a Comment