VyOS with Host sFlow agent describes support for streaming sFlow telemetry added to the open source
VyOS router operating system. This article describes how to install analytics software on a VyOS router by configuring a container.
vyos@vyos:~$ add container image sflow/ddos-protect
First, download the
sflow/ddos-protect image.
vyos@vyos:~$ mkdir -m 777 /config/sflow-rt
Create a directory to store persistent container state.
set container name sflow-rt image sflow/ddos-protect
set container name sflow-rt allow-host-networks
set container name sflow-rt arguments '-Dhttp.hostname=10.0.0.240'
set container name sflow-rt environment RTMEM value 200M
set container name sflow-rt memory 0
set container name sflow-rt volume store source /config/sflow-rt
set container name sflow-rt volume store destination /sflow-rt/store
Configure a container to run the image. The
RMEM environment variable setting limits the amount of memory that the container will use to
200M bytes. The
-Dhttp.hostname argument sets the internal web server to listen on management address,
10.0.0.240, assigned to
eth0 on this router. The container has is no built-in authentication, so access needs to be limited using an ACL or through a reverse proxy - see
Download and install.
set system sflow interface eth0
set system sflow interface eth1
set system sflow interface eth2
set system sflow polling 30
set system sflow sampling-rate 1000
set system sflow drop-monitor-limit 50
set system sflow server 127.0.0.1
Next, configure sFlow agent to send to localhost (127.0.0.1).
Finally connect to the web interface on the router at port 8008. The status page verifies that the sFlow-RT analytics engine is receiving sFlow from 1
sFlow Agent (the VyOS router). See
Getting started for more information.
The included
Flow Browser application provides an up to the second view traffic flows.
Defining Flows describes the fields that can be used to break out traffic.
VyOS dropped packet notifications describes how to configure and monitor sFlow dropped packet notifications. The included
Discard Browser provides an up to the second view of dropped packets.
The included
Metric Browser application lets you explore the metrics that are being streamed. The chart updates in real-time as data arrives and in this case shows CPU utilization on the VyOS router. The standard set of metrics exported by the Host sFlow agent include interface counters as well as host cpu, memory, network and disk performance metrics.
Metrics lists the set of available metrics.
Flow metrics with Prometheus and Grafana describes how integrate flow analytics into operational dashboards. The included
Prometheus application exposes flow analytics in the standard Prometheus scrape format so that they can be logged in time series databases.
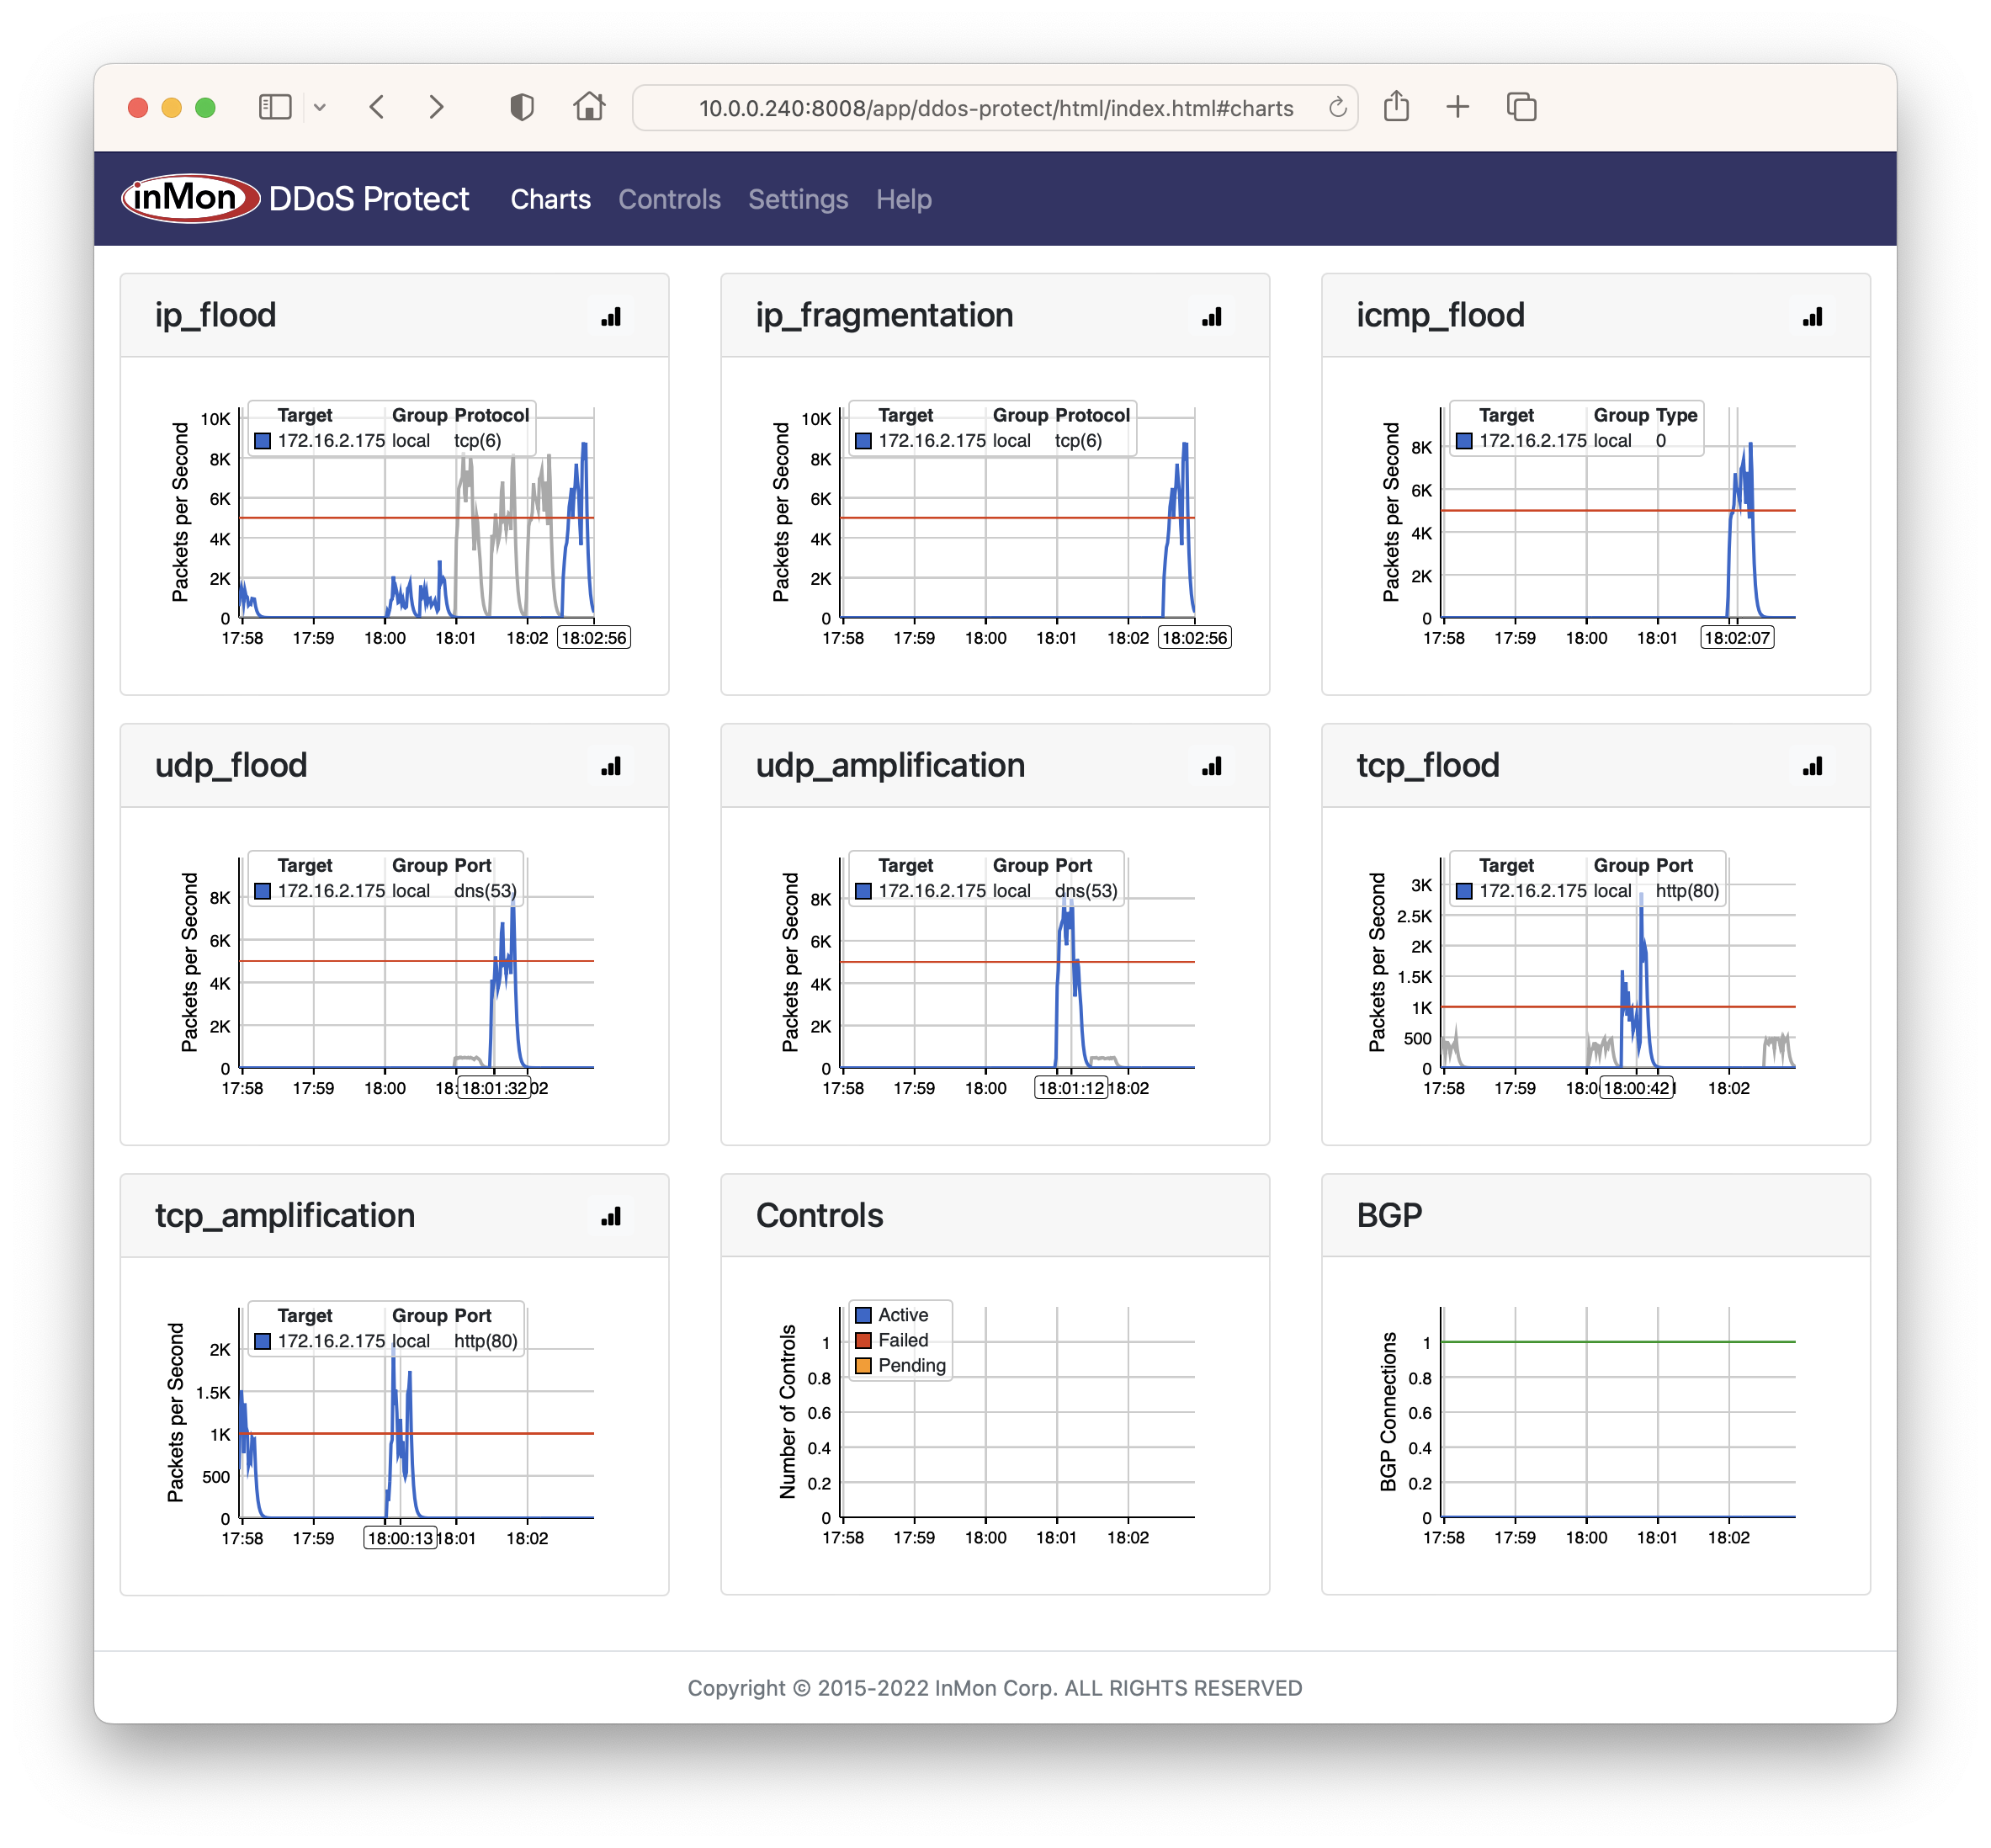
DDoS protection quickstart guide describes how to use real-time sFlow analytics with BGP Flowspec / RTBH to automatically mitigate DDoS attacks. The included
DDoS Protect application detects common volumetric attacks and can apply automated responses. The screen capture shows traffic associated with a series of simulated DDoS attacks against hosts behind the VyOS router, see
DDoS attacks and BGP Flowspec responses.
The embedded sFlow-RT analytics engine exposes a REST API that can be used to program flow analytics, set thresholds, monitor events, and gather statistics. In addition, the applications shown in this article were all written using sFlow-RT's embedded scripting API. See
Writing Applications for more information.


No comments:
Post a Comment