Sunday, February 19, 2012

10 Gigabit Ethernet


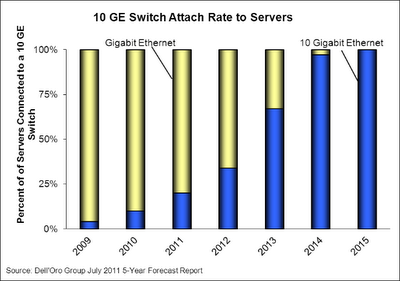
Dell'Oro predicts that the transition to majority 10 Gigabit Etherent (10 GE) server deployment will occur within the next two years and that most of the growth in networking sales will be of fixed configuration 10G switches.

Drivers for the move to 10G networking include:
  • Multi-core processors and blade servers greatly increase computational density, creating a corresponding demand for bandwidth.
  • Integration of 10G networking on server motherboards (see Intel's 10G 'Romley' server to spur Ethernet switch growth).
  • Virtualization and server consolidation ensures that servers are fully utilized, further increasing demand for bandwidth.
  • Increase in networked storage, spurred by virtualization, increases demand for bandwidth.
  • Rapidly dropping price of 10G switches, driven by the availability of merchant silicon.
Since most networks are predicted to upgrade to 10G fixed configuration (top of rack) switches in the next two years, organizations need to consider the changing role of top of rack switches and the strategic importance of the network edge in providing visibility and control within the data center.

Top of rack switches have been treated as the poor step child of networking - deployed as a dumb access layer to the core switches where all the intelligence and control is applied. This approach works well if most of the data center traffic flows between the servers and the Internet  - referred to as North-South traffic. However, the growth in converged storage and virtualization that is driving demand for bandwidth and the transition to 10G is also fundamentally altering traffic paths - most of the new traffic is local communication within the data center - referred to as East-West traffic. Examples of East-West traffic include: access to local storage, storage replication, virtual machine migration and scale-out clustered applications (like Hadoop).

Image from 802.aq and Trill
High speed switch fabrics use shortest path bridging to increase East-West bandwidth and reduce latency. As traffic bypasses the core, visibility and control functions shift to the network edge and the "core" becomes a distributed, high performance, multi-path, interconnect between the top of rack switches.

Most 10G top of rack switches now rely on merchant silicon. However, there are significant differences in which hardware features each vendor exposes and the ease with which these capabilities can be managed in order to create an intelligent edge.
Image from Merchant silicon
Support for the sFlow monitoring standard is included in switch chips from leading merchant silicon vendors and most switch vendors implement the sFlow standard in their 10G top of rack switches; providing critical visibility into server I/O, including networked storage (e.g. AoE and FCoE), server clusters and virtualized routing.

Choosing sFlow for performance monitoring provides the scalability to centrally monitor tens of thousands of 10G switch ports in the top of rack switches, as well as their 40 Gigabit uplink ports. In addition, sFlow is also available in 100 Gigabit switches, ensuring visibility as higher speed interconnects are deployed to support the growing 10 Gigabit edge.

Finally, the sFlow standard addresses the broader challenge of managing large, converged data centers by integrating network, server, storage and application performance monitoring to provide the comprehensive view of data center performance needed for effective control.

Sunday, February 5, 2012

Desktop virtualization

Figure 1: Desktop computer components
A desktop PC consists of a computer with CPU, memory and disk resources running applications directly connected to a monitor, keyboard and mouse. Desktop virtualization delivers the functionality of a desktop PC as a cloud service.

Figure 2: Virtualized desktop
Desktop virtualization disaggregates the desktop computer, relying on the network to logically connect the monitor, keyboard and mouse to a virtual machine in the data center. The virtual machine provides the computational and memory resources needed to run desktop applications. The server hosting the virtual machines connects to data center storage clusters to access user data and operating system images.

Consolidating desktop computational and storage resources in the data center improves efficiency and reduces administrative costs. In addition, desktop virtualization makes desktop environments accessible from a variety of devices, including home PCs, thin clients, smart phones and tablets.

Looking at Figure 2, it is clear that the desktop virtualization service is critically dependent on the network (represented by the cloud). Poor network performance can result in slow screen updates and delayed responses to keyboard presses and mouse clicks. Network congestion can affect access to storage, increasing the time taken to start desktop sessions and launch applications. Virtual machines hosting desktop sessions share computational resources on the server and disks in the storage arrays, resources need to be carefully managed in order to prevent performance problems from propagating.

End-to-end visibility into the resources needed to deliver desktop virtualization is essential to ensure that services are adequately provisioned. Desktop virtualization protocols (e.g. Microsoft RDP, Citrix ICA/HDX, Redhat SPICE and Teradici PCoIP) already measure quality of service in order to adapt sessions to different network conditions and clients. However, these measurements are not easily accessible to management tools.

The sFlow standard provides an integrated framework for monitoring the performance of network, server, storage and applications resources. Extending sFlow to report on desktop virtualization sessions provides end to end visibility into quality of service. As a proof of concept, the Host sFlow agent has been extended to report PCoIP metrics. The sFlow agent was installed on all the virtual machines in a VMware View 5 (VMware VDI) cluster. Exporting the metrics using sFlow is extremely efficient, allowing tens of thousands of desktop virtualization sessions to be monitored in real-time.
Figure 3: Receiving sFlow from network, servers and applications
Figure 3 shows each switch, server, virtual machine and application continuously sending a stream of sFlow measurements to a central analyzer. The following charts provide a dashboard showing critical application, server and network metrics:


Figure 4: VDI performance dashboard
The charts on the dashboard summarize data collected from all the switches, servers and VDI sessions running in the server pool. The application layer frame rate, image quality, round trip time and packet loss metrics characterize the quality of service (QoS) being delivered to desktop virtualization users. System loads and disk access times are critical metrics describing the performance of the compute infrastructure. Finally, the network traffic levels and packet discard rates summarize network performance.

All three layers are linked, for example a decrease in video frame rate may be due to slow disk I/O which in turn might be caused by packet discards on the network. While the dashboard simplifies management by showing aggregate cluster performance, sFlow's centralized architecture provides the data needed to identify busy servers, map application dependencies, monitor networked storage and quickly identify sources of network congestion.

Wednesday, February 1, 2012

Ganglia 3.3 released


Ganglia 3.2 was the first release to include native sFlow support. The latest Ganglia 3.3 release includes a new web user interface and adds support for additional sFlow metrics:
The Host sFlow distributed agent efficiently exports metrics from Windows, Linux and FreeBSD servers as well as Hyper-V, XenServer, XCP and Xen hypervisors. Additional sFlow agents are available for Java, Apache, Tomcat, NGINX, node.js and Memcached.