Thursday, November 17, 2022
SC22 SCinet network monitoring
Wednesday, November 16, 2022
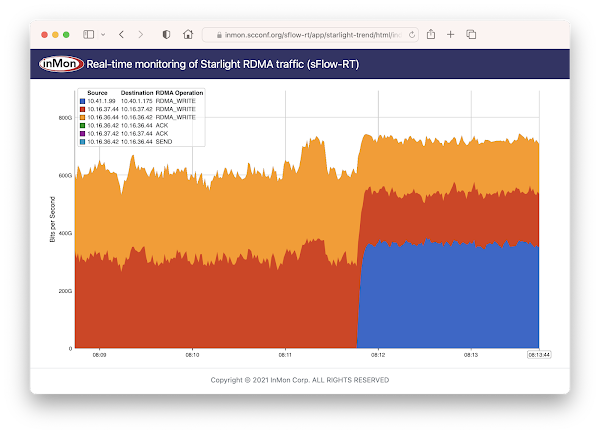
RDMA network visibility
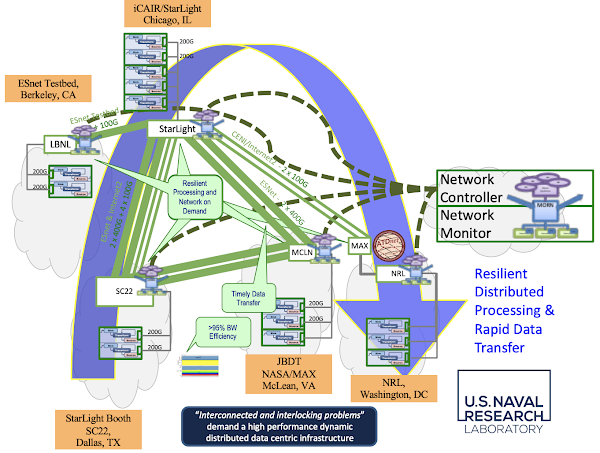
- RDMA Tbps performance over global distance for timely Terabyte bulk data transfers (goal << 1 min Tbyte transfer on N by 400G network).
- Dynamic shifting of processing and network resources from on location/path/system to another (in response to demand and availability).
Real-time traffic analytics transforms network monitoring from reporting on the past to observing and acting on the present to automate troubleshooting and traffic engineering, e.g. Leaf and spine traffic engineering using segment routing and SDN and DDoS protection quickstart guide.
Tuesday, November 15, 2022
Scientific network tags (scitags)
Scientific network tags (scitags) is an initiative promoting identification of the science domains and their high-level activities at the network level. Participants include, dCache, ESnet, GÉANT, Internet2, Jisc, NORDUnet, OFTS, OSG, RNP, RUCIO, StarLight, XRootD.
This article will demonstrate how industry standard sFlow telemetry streaming from switches and routers can be used to report on science domain activity in real-time using the sFlow-RT analytics engine.
The scitags initiative makes use of the IPv6 packet header to mark traffic. Experiment and activity identifiers are encoded in the IPv6 Flow label field. Identifiers are published in an online registry in the form of a JSON document, https://www.scitags.org/api.json.
One might expect IPFIX / NetFlow to be a possible alternative to sFlow for scitags reporting, but with NetFlow/IPFIX the network devices summarize the traffic before exporting flow records containing only the fields they decode in the firmware, and currently leading vendors such as Arista, Cisco and Juniper do not include the IPv6 flow label as a field that can be exported. A firmware/hardware update would be needed to access the data. And the same roadblock may repeat for cases where the IPv6 is carried over a new tunnel encapsulation, or for any other new field that may be requested.
On the other hand, the sFlow protocol disaggregates the flow analytics pipeline, devices stream raw packet headers and metadata in real-time to an external analyzer which decodes the packets and builds flow records - see RESTflow for more information. This means that visibility into scitags traffic is available today from every sFlow capable device released over the last 20 years with no vendor involvement - the only requirement is an sFlow collector that decodes IPv6 packet headers. Vendors supporting sFlow include: A10, Arista, Aruba, Cisco, Edge-Core, Extreme, Huawei, Juniper, NEC, NVIDIA, Netgear, Nokia, Quanta, and ZTE.
Finally, real-time visibility is a key benefit of using sFlow. The IPFIX / NetFlow flow cache on the router adds significant delay to measurements (anything from 30 seconds to 30 minutes for long lived science flows based on the active timeout setting). With sFlow, data is immediately exported by the router, allowing the sFlow analyzer to present an up to the second view of traffic. Real-time traffic analytics transforms network monitoring from reporting on the past to observing and acting on the present to automate troubleshooting and traffic engineering, e.g. Leaf and spine traffic engineering using segment routing and SDN and DDoS protection quickstart guide.
function reverseBits(val,n) {
  var bits = val.toString(2).padStart(n, '0');
  var reversed = bits.split('').reverse().join('');
  return parseInt(reversed,2);
}

function flowlabel(expId,activityId) {
  return (reverseBits(expId,9) << 9) + (activityId << 2);
}

function updateMap() {
  var tags, parsed;
  try {
    tags = http('https://www.scitags.org/api.json');
    parsed = JSON.parse(tags);
  } catch(e) {
    logWarning('SCITAGS http get failed ' + e);
    return;
  }
  var experiments = parsed && parsed.experiments;
  if(!experiments) return;
  var map = {};
  experiments.forEach(function(experiment) {
    var expName = experiment.expName;
    var expId = experiment.expId;
    var activities = experiment.activities;
    activities.forEach(function(activity) {
      var activityName = activity.activityName;
      var activityId = activity.activityId;
      var key = (expName + '.' + activityName).replace(/ /g,"_");
      map[key] = [ flowlabel(expId,activityId) ];
    });
  });

  setMap('scitag',map);
}

updateMap();
setIntervalHandler(updateMap,600);
The above scitags.js script periodically queries the registry and creates an sFlow-RT map from flow label to registry entry. See Writing Applications for more information on the script.
docker run --rm -v $PWD/scitags.js:/sflow-rt/scitags.js \
-p 8008:8008 -p 6343:6343/udp sflow/prometheus -Dscript.file=scitags.js
Use the above command to run sFlow-RT with the scitags.js using the pre-built sflow/prometheus image.
map:[bits:ip6flowlabel:261884]:scitag
Defining Flows describes how program sFlow-RT's flow analytics engine. The example above shows how to use the bits: function to mask out the Entropy bits from the ip6flowlabel and extract the Activity and Experiment bits (00111111111011111100 binary is 261884 in decimal). The masked value is used as a key in the scitag map built by the scitags.js script.
The Browse Flows trend above shows a network traffic flow identified by its scitag value.
iperf3 -c 2001:172:16:2::2 --flowlabel 65572
The ESnet iperf3 tool was used to generate the IPv6 traffic with configured flowlabel shown in the chart.
Flow metrics with Prometheus and Grafana describes how to export flow analytics to a time series database for use in operational dashboards.
  - job_name: 'sflow-rt-scitag-bps'
    metrics_path: /app/prometheus/scripts/export.js/flows/ALL/txt
    static_configs:
      - targets: ['127.0.0.1:8008']
    params:
      metric: ['scitag_networks_bps']
      key: ['ip6source','ip6destination','map:[bits:ip6flowlabel:261884]:scitag']
      label: ['src','dst','scitag']
      value: ['bytes']
      scale: ['8']
      aggMode: ['sum']
      minValue: ['1000']
      maxFlows: ['100']
For example, the Prometheus scrape job above collects the data shown in the Browse Flows chart.
The chart above shows a Grafana dashboard displaying the scitag flow data.


