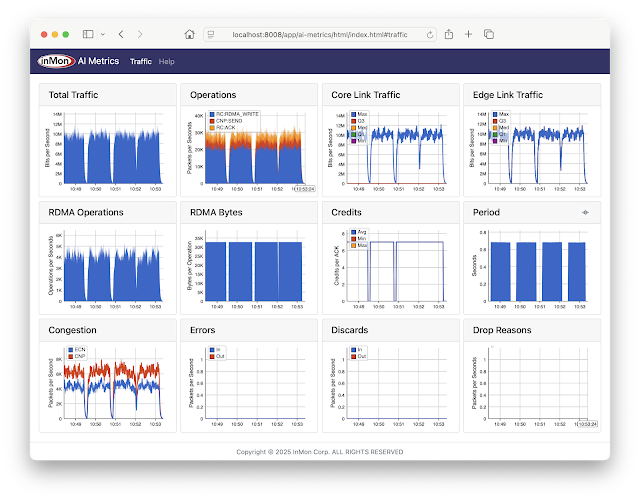
The screen capture is from a containerlab topology that emulates a AI compute cluster connected by a leaf and spine network. The metrics include:
- Total Traffic Total traffic entering fabric
- Operations Total RoCEv2 operations broken out by type
- Core Link Traffic Histogram of load on fabric links
- Edge Link Traffic Histogram of load on access ports
- RDMA Operations Total RDMA operations
- RDMA Bytes Average RDMA operation size
- Credits Average number of credits in RoCEv2 acknowledgements
- Period Detected period of compute / exchange activity on fabric (in this case just over 0.5 seconds)
- Congestion Total ECN / CNP congestion messages
- Errors Total ingress / egress errors
- Discards Total ingress / egress discards
- Drop Reasons Packet drop reasons
Note: Clicking on peaks in the charts shows values at that time.
This article gives step-by-step instructions to run the demonstration.
git clone https://github.com/sflow-rt/containerlab.gitDownload the sflow-rt/containerlab project from GitHub.
git clone https://github.com/sflow-rt/containerlab.git
cd containerlab
./run-clab
Run the above commands to download the sflow-rt/containerlab GitHub project and run Containerlab on a system with Docker installed. Docker Desktop is a conventient way to run the labs on a laptop.
containerlab deploy -t rocev2.yml
Start the 3 stage leaf and spine emulation.
The initial launch may take a couple of minutes as the container images are downloaded for the first time. Once the images are downloaded, the topology deploys in a few seconds../topo.py clab-rocev2Run the command above to send the topology to the AI Metrics application and connect to http://localhost:8008/app/ai-metrics/html/ to access the dashboard shown at the top of this article.
docker exec -it clab-rocev2-h1 hping3 exec rocev2.tcl 172.16.2.2 10000 500 100Run the command above to simulate RoCEv2 traffic between h1 and h2 during a training run. The run consists of 100 cycles, each cycle involves exchange of 10000 packets followed by a 500 millisecond pause (similuating GPU compute time). You should immediately see charts updating in the dashboard. Clicking on the wave symbol in the top right of the Period chart pulls up a fast updating Periodicity chart that shows how sub-second variability in the traffic due to the exchange / compute cycles is used to compute the period shown in the dashboard, in this case a period of just under 0.7 seconds. Connect to the included sflow-rt/trace-flow application, http://localhost:8008/app/trace-flow/html/
suffix:stack:.:1=ibbtEnter the filter above and press Submit. The instant a RoCEv2 flow is generated, its path should be shown. See Defining Flows for information on traffic filters.
docker exec -it clab-rocev2-leaf1 vtyshThe routers in this topology run the open source FRRouting daemon used in data center switches with NVIDIA Cumulus Linux or SONiC network operating systems. Type the command above to access the CLI on the leaf1 switch.
leaf1# show running-configFor example, type the above command in the leaf1 CLI to see the running configuration.
Building configuration...

Current configuration:
!
frr version 10.2.3_git
frr defaults datacenter
hostname leaf1
log stdout
!
interface eth3
 ip address 172.16.1.1/24
 ipv6 address 2001:172:16:1::1/64
exit
!
router bgp 65001
 bgp bestpath as-path multipath-relax
 bgp bestpath compare-routerid
 neighbor fabric peer-group
 neighbor fabric remote-as external
 neighbor fabric description Internal Fabric Network
 neighbor fabric capability extended-nexthop
 neighbor eth1 interface peer-group fabric
 neighbor eth2 interface peer-group fabric
 !
 address-family ipv4 unicast
  redistribute connected route-map HOST_ROUTES
 exit-address-family
 !
 address-family ipv6 unicast
  redistribute connected route-map HOST_ROUTES
  neighbor fabric activate
 exit-address-family
exit
!
route-map HOST_ROUTES permit 10
 match interface eth3
exit
!
ip nht resolve-via-default
!
end
The switch is using BGP to establish equal cost multi-path (ECMP) routes across the fabric - this is very similar to a configuration you would expect to find in a production network. Containerlab provides a great environment to experiment with topologies and configuration options before putting them in production.
The results from this containerlab project are very similar to those observed in production networks, see Comparing AI / ML activity from two production networks. Follow the instruction in AI Metrics with Prometheus and Grafana to deploy this solution to monitor production GPU cluster traffic.


No comments:
Post a Comment