Monday, March 27, 2023

VyOS dropped packet notifications

VyOS with Host sFlow agent describes how to configure and analyze industry standard sFlow telemetry recently added to the VyOS open source router platform. This article discusses sFlow dropped packet notifications support added to the latest release.

Dropped packets have a profound impact on network performance and availability. Packet discards due to congestion can significantly impact application performance. Dropped packets due to black hole routes, expired TTLs, MTU mismatches, etc. can result in insidious connection failures that are time consuming and difficult to diagnose. Visibility into dropped packets offers significant benefits for network troubleshooting, providing real-time network-wide visibility into the specific packets that were dropped as well the reason the packet was dropped. This visibility instantly reveals the root cause of drops and the impacted connections.

vyos@vyos:~$ show version
Version:          VyOS 1.4-rolling-202303260914
Release train:    current

Built by:         autobuild@vyos.net
Built on:         Sun 26 Mar 2023 09:14 UTC
Build UUID:       72b34f74-bfcd-4b51-9b95-544319c2dac5
Build commit ID:  d68bda6a295ba9

Architecture:     x86_64
Boot via:         installed image
System type:       guest

Hardware vendor:  innotek GmbH
Hardware model:   VirtualBox
Hardware S/N:     0
Hardware UUID:    df0a2b79-b8c4-8342-a27f-76aa3e52ad6d

Copyright:        VyOS maintainers and contributors

Verify that the version of of VyOS is VyOS 1.4-rolling-202303260914 or later.

On VyOS dropped packet monitoring relies on instrumentation built into recent Linux kernels and exposed through the netlink drop_monitor API. Enabling drop_monitor in VyOS kernel configuration allows the Host sFlow agent to capture and export information on dropped packets.
set system sflow interface eth0
set system sflow interface eth1
set system sflow interface eth2
set system sflow polling 30
set system sflow sampling-rate 1000
set system sflow drop-monitor-limit 50
set system sflow server 10.0.0.30 port 6343
The drop-monitor-limit configuration entry enables dropped packet monitoring and sets a rate limit of 50 dropped packets notifications per second.
docker run --name sflow-rt -p 8008:8008 -p 6343:6343/udp -d sflow/prometheus

A quick way to experiment with sFlow is to run the pre-built sflow/prometheus image using Docker on the sFlow server (in this case on 10.0.0.30). The chart at the top of the page uses the Discard Browser application to display an up to the second view of packets dropped by the VyOS router, click on this link to open the application with the settings shown.

The chart shows the results of two tests, the first a failed attempt to connect to the VyOS router using telnet (telnet has been disabled in the router config), and the second a traceroute test between two hosts connected to the router. The reason field reports the sFlow drop reason code and the function reports the linux kernel function that dropped the packet. With the telnet test, the packet was dropped in the tcp_v4_rcv function and is reported as an unknown_l4 sFlow reason. In the case of the traceroute test, 3 packets were dropped in the ip_forward function and are reported as unknown_l3 reason.

Enabling sFlow dropped packet notifications on all switches, routers, and hosts provides end-to-end visibility into dropped packets, rapidly identifying the location and reason for packet drops as well as identifying the impacted services.

Dropped packet monitoring complements sFlow's existing counter polling and packet sampling mechanisms and shares a common data model so that all three sources of data can be correlated. For example, if packets are being discarded because of buffer exhaustion, the discard records don't necessarily tell the whole story. The discarded packets may represent mice flows that are victims of an elephant flow. Packet samples will reveal the traffic that isn't being dropped and provide a more complete picture. Counter data adds additional information such as CPU load, interface speed, link utilization, packet and discard rates that further completes the picture.

Friday, March 17, 2023

VyOS with Host sFlow agent

VyOS described deficiencies with the embedded sFlow implementation in the open source VyOS router operating system and suggested that the open source Host sFlow agent be installed as an alternative. The VyOS developer community embraced the suggestion and has been incredibly responsive,  integrating, and releasing a version of VyOS with Host sFlow support within a week.
vyos@vyos:~$ show version
Version:          VyOS 1.4-rolling-202303170317
Release train:    current

Built by:         autobuild@vyos.net
Built on:         Fri 17 Mar 2023 03:17 UTC
Build UUID:       45391302-1240-4cc7-95a8-da8ee6390765
Build commit ID:  e887f582cfd7de

Architecture:     x86_64
Boot via:         installed image
System type:       guest

Hardware vendor:  innotek GmbH
Hardware model:   VirtualBox
Hardware S/N:     0
Hardware UUID:    871dd0f0-c4ec-f147-b1a7-ed536511f141

Copyright:        VyOS maintainers and contributors
Verify that the version of of VyOS is VyOS 1.4-rolling-202303170317 or later
set system sflow interface eth0
set system sflow interface eth1
set system sflow interface eth2
set system sflow polling 30
set system sflow sampling-rate 1000
set system sflow server 10.0.0.30 port 6343
The above commands configure sFlow export in the VyOS CLI using the embedded Host sFlow agent.
docker run --name sflow-rt -p 8008:8008 -p 6343:6343/udp -d sflow/prometheus
A quick way to experiment with sFlow is to run the pre-built sflow/prometheus image using Docker on the sFlow server (in this case on 10.0.0.30). The chart at the top of the page uses the Flow Browser application to display an up to the second view of the largest tcp flows through the VyOS router, click on this link to open the application with the settings shown.
Flow metrics with Prometheus and Grafana describes how integrate flow analytics into operational dashboards.
DDoS protection quickstart guide describes how to use real-time sFlow analytics with BGP Flowspec / RTBH to automatically mitigate DDoS attacks.

Saturday, March 11, 2023

VyOS

VyOS is an open source router operating system based on Linux. This article discusses how to improve network traffic visibility on VyOS based routers using the open source Host sFlow agent.

VyOS claims sFlow support, so why is it necessary to install an alternative sFlow agent? The following experiment demonstrates that there are significant issues with the VyOS sFlow implementation.

vyos@vyos:~$ show version
Version:          VyOS 1.4-rolling-202301260317
Release train:    current

Built by:         autobuild@vyos.net
Built on:         Thu 26 Jan 2023 03:17 UTC
Build UUID:       a95385b7-12f9-438d-b49c-b91f47ea7ab7
Build commit ID:  d5ea780295ef8e

Architecture:     x86_64
Boot via:         installed image
System type:      KVM guest

Hardware vendor:  innotek GmbH
Hardware model:   VirtualBox
Hardware S/N:     0
Hardware UUID:    6988d219-49a6-0a4a-9413-756b0395a73d

Copyright:        VyOS maintainers and contributors
Install a recent version of VyOS under VirtualBox and configure routing between two Linux virtual machines connected to eth1 and eth2 on the router. Out of band management is configured on eth0.
set system flow-accounting disable-imt
set system flow-accounting sflow agent-address 10.0.0.50
set system flow-accounting sflow sampling-rate 1000
set system flow-accounting sflow server 10.0.0.30 port 6343
set system flow-accounting interface eth0
set system flow-accounting interface eth1
set system flow-accounting interface eth2
The above commands configure sFlow monitoring on VyOS using the native sFlow agent.
The sflow/sflow-test tool is used to test the sFlow implementation while generating traffic consisting of a series of iperf3 tests (each generating approximately 50Mbps). The test fails in a number of significant ways:
  1. The implementation of sFlow is incomplete, omitting required interface counter export
  2. The peak traffic reported (3Mbps) is a fraction of the traffic generated by iperf3
  3. There is an inconsistency in the packet size reported in the sFlow messages
  4. Tests comparing counters and flow data fail because of missing counter export (1)
Fortunately, VyOS is a Linux based operating system, so we can install the Host sFlow agent as an alternative to the native sFlow implementation to provide traffic visibility.
delete system flow-accounting
First, disable the native VyOS sFlow agent.
wget https://github.com/sflow/host-sflow/releases/download/v2.0.38-1/hsflowd-ubuntu20_2.0.38-1_amd64.deb
sudo dpkg -i hsflowd-ubuntu20_2.0.38-1_amd64.deb
Next, download and install the Host sFlow agent by typing the above commands in VyOS shell.
# hsflowd configuration file
# http://sflow.net/host-sflow-linux-config.php

sflow {
  collector { ip=10.0.0.30 }
  pcap { dev = eth0 }
  pcap { dev = eth1 }
  pcap { dev = eth2 }
}
Edit the /etc/hsflowd.conf file.
systemctl restart hsflowd
Restart the sFlow agent to pick up the new configuration.
Rerunnig sflow-test shows that the implementation now passes. The peaks shown in the trend graph are consistent with the traffic generated by iperf3 and with traffic levels reported in interface counters.
The sflow/sflow-test Docker image also includes the Flow Browser application that can be used to monitor traffic flows in real-time. The screen shot above shows traffic from a single iperf3 test.
The sflow/sflow-test Docker image also includes the Metric Browser application that can be used to monitor counters in real-time. The screen shot above shows cpu_utilization.

The sFlow Test, Browse Flows and Browse Metrics applications run on the sFlow-RT analytics engine. Additional examples include Flow metrics with Prometheus and Grafana and DDoS protection quickstart guide.

Tuesday, February 14, 2023

Real-time flow analytics with Containerlab templates

The GitHub sflow-rt/containerlab project contains example network topologies for the Containerlab network emulation tool that demonstrate real-time streaming telemetry in realistic data center topologies and network configurations. The examples use the same FRRouting (FRR) engine that is part of SONiC, NVIDIA Cumulus Linux, and DENT. Containerlab can be used to experiment before deploying solutions into production. Examples include: tracing ECMP flows in leaf and spine topologies, EVPN visibility, and automated DDoS mitigation using BGP Flowspec and RTBH controls.

This article describes an experiment with Containerlab's advanced Generated topologies capability, taking the 3 stage Clos topology shown above and creating a template that can be used to generate topologies with any number of leaf and spine switches.

The clos3.yml topology file specifies the 2 leaf 2 spine topology shown above:

name: clos3
mgmt:
  network: fixedips
  ipv4_subnet: 172.100.100.0/24
  ipv6_subnet: 2001:172:100:100::/80

topology:
  defaults:
    env:
      COLLECTOR: 172.100.100.8
  nodes:
    leaf1:
      kind: linux
      image: sflow/clab-frr
      mgmt_ipv4: 172.100.100.2
      mgmt_ipv6: 2001:172:100:100::2
      env:
        LOCAL_AS: 65001
        NEIGHBORS: eth1 eth2
        HOSTPORT: eth3
        HOSTNET: "172.16.1.1/24"
        HOSTNET6: "2001:172:16:1::1/64"
      exec:
        - touch /tmp/initialized
    leaf2:
      kind: linux
      image: sflow/clab-frr
      mgmt_ipv4: 172.100.100.3
      mgmt_ipv6: 2001:172:100:100::3
      env:
        LOCAL_AS: 65002
        NEIGHBORS: eth1 eth2
        HOSTPORT: eth3
        HOSTNET: "172.16.2.1/24"
        HOSTNET6: "2001:172:16:2::1/64"
      exec:
        - touch /tmp/initialized
    spine1:
      kind: linux
      image: sflow/clab-frr
      mgmt_ipv4: 172.100.100.4
      mgmt_ipv6: 2001:172:100:100::4
      env:
        LOCAL_AS: 65003
        NEIGHBORS: eth1 eth2
      exec:
        - touch /tmp/initialized
    spine2:
      kind: linux
      image: sflow/clab-frr
      mgmt_ipv4: 172.100.100.5
      mgmt_ipv6: 2001:172:100:100::5
      env:
        LOCAL_AS: 65003
        NEIGHBORS: eth1 eth2
      exec:
        - touch /tmp/initialized
    h1:
      kind: linux
      image: sflow/clab-iperf3
      mgmt_ipv4: 172.100.100.6
      mgmt_ipv6: 2001:172:100:100::6
      exec:
        - ip addr add 172.16.1.2/24 dev eth1
        - ip route add 172.16.2.0/24 via 172.16.1.1
        - ip addr add 2001:172:16:1::2/64 dev eth1
        - ip route add 2001:172:16:2::/64 via 2001:172:16:1::1
    h2:
      kind: linux
      image: sflow/clab-iperf3
      mgmt_ipv4: 172.100.100.7
      mgmt_ipv6: 2001:172:100:100::7
      exec:
        - ip addr add 172.16.2.2/24 dev eth1
        - ip route add 172.16.1.0/24 via 172.16.2.1
        - ip addr add 2001:172:16:2::2/64 dev eth1
        - ip route add 2001:172:16:1::/64 via 2001:172:16:2::1
    sflow-rt:
      kind: linux
      image: sflow/prometheus
      mgmt_ipv4: 172.100.100.8
      mgmt_ipv6: 2001:172:100:100::8
      ports:
        - 8008:8008
  links:
    - endpoints: ["leaf1:eth1","spine1:eth1"]
    - endpoints: ["leaf1:eth2","spine2:eth1"]
    - endpoints: ["leaf2:eth1","spine1:eth2"]
    - endpoints: ["leaf2:eth2","spine2:eth2"]
    - endpoints: ["h1:eth1","leaf1:eth3"]
    - endpoints: ["h2:eth1","leaf2:eth3"]

The new clos3.clab.gotmpl file is a templated version of the topology:

name: clos3
mgmt:
  network: fixedips
  ipv4_subnet: 172.100.100.0/24
  ipv6_subnet: 2001:172:100:100::/80
topology:
  defaults:
    kind: linux
    env:
      COLLECTOR: 172.100.100.{{ add $.spines.num $.leaves.num $.leaves.num 2 }}
  nodes:
{{- range $leafIndex := seq 1 $.leaves.num }}
    leaf{{ $leafIndex }}:
        image: sflow/clab-frr
        mgmt_ipv4: 172.100.100.{{ add $leafIndex 1 }}
        mgmt_ipv6: 2001:172:100:100::{{ add $leafIndex 1 }}
        env:
            LOCAL_AS: {{ add 65000 $leafIndex }}
            NEIGHBORS:{{- range $spineIndex := seq 1 $.spines.num }} eth{{ $spineIndex}}{{- end }}
            HOSTPORT: eth{{ add $.spines.num 1 }}
            HOSTNET: 172.16.{{ $leafIndex }}.1/24
            HOSTNET6: 2001:172:16:{{ $leafIndex }}::1/64
        exec:
            - touch /tmp/initialized
{{- end }}
{{- range $spineIndex := seq 1 $.spines.num }}
    spine{{ $spineIndex }}:
        image: sflow/clab-frr  
        mgmt_ipv4: 172.100.100.{{ add $.leaves.num $spineIndex 1 }}      
        mgmt_ipv6: 2001:172:100:100::{{ add $.leaves.num $spineIndex 1 }}
        env:
            LOCAL_AS: {{ add 65000 $.leaves.num 1 }}
            NEIGHBORS:{{- range $leafIndex := seq 1 $.leaves.num }} eth{{ $leafIndex }}{{- end }}
        exec:
            - touch /tmp/initialized
{{- end }}
{{- range $leafIndex := seq 1 $.leaves.num }}
    h{{ $leafIndex }}:   
        image: sflow/clab-iperf3
        mgmt_ipv4: 172.100.100.{{ add $.spines.num $.leaves.num $leafIndex 1 }}
        mgmt_ipv6: 2001:172:100:100::{{ add $.spines.num $.leaves.num $leafIndex 1 }}
        exec:
            - ip addr add 172.16.{{ $leafIndex }}.2/24 dev eth1
            - ip route add 172.16.0.0/16 via 172.16.{{ $leafIndex }}.1
            - ip addr add 2001:172:16:{{ $leafIndex }}::2/64 dev eth1
            - ip route add 2001:172:16::/48 via 2001:172:16:{{ $leafIndex }}::1             
{{- end }}
    sflow-rt:
        image: sflow/prometheus
        mgmt_ipv4: 172.100.100.{{ add $.spines.num $.leaves.num $.leaves.num 2 }}
        mgmt_ipv6: 2001:172:100:100::{{ add $.spines.num $.leaves.num $.leaves.num 2 }}
        ports:
            - 8008:8008
  links:
{{- range $spineIndex := seq 1 $.spines.num }}
  {{- range $leafIndex := seq 1 $.leaves.num }}
    - endpoints: ["spine{{ $spineIndex }}:eth{{ $leafIndex }}", "leaf{{ $leafIndex }}:eth{{ $spineIndex }}"]
  {{- end }}
{{- end }}
{{- range $leafIndex := seq 1 $.leaves.num }}
    - endpoints: ["leaf{{ $leafIndex }}:eth{{ add $.spines.num 1 }}", "h{{ $leafIndex }}:eth1"]
{{- end }}
The template makes uses of settings in the corresponsing clos3.clab_vars.yml file:
spines:
  num: 2
leaves:
  num: 2
While creating a template involves some work, the result is a more compact representation of the configuration since repetative leaf and spine configurations are captures in iterative blocks. The advantage becomes clear with larger topologies since a 4 leaf 4 spine explicit configuration would be twice as large, but the tempate remains unchanged.
docker run --rm -it --privileged --network host --pid="host" \
  -v /var/run/docker.sock:/var/run/docker.sock -v /run/netns:/run/netns \
  -v $(pwd):$(pwd) -w $(pwd) \
  ghcr.io/srl-labs/clab bash
Run the above command to start Containerlab.
wget https://raw.githubusercontent.com/sflow-rt/containerlab/master/clos3.clab.gotmpl
wget https://raw.githubusercontent.com/sflow-rt/containerlab/master/clos3.clab_vars.yml
Download the template and settings files.
containerlab deploy -t clos3.clab.gotmpl
Create the emulated network.
docker exec -it clab-clos3-leaf1 vtysh -c "show running-config"
See configuration of leaf1 router.
Connect to the web interface, http://localhost:8008. The sFlow-RT dashboard verifies that telemetry is being received from the four (two leaf and two spine) switches in the topology. See the sFlow-RT Quickstart guide for more information.
The screen capture shows a real-time view of traffic flowing across the network during an iperf3 tests. Click on the sFlow-RT Apps menu and select the browse-flows application, or click here for a direct link to a chart with the settings shown above.
docker exec -it clab-clos3-h1 iperf3 -c 172.16.2.2
Each of the hosts in the network has an iperf3 server, so running the above command will test bandwidth between h1 and h2.
containerlab destroy -t clos3.clab.gotmpl

When you are finished, run the above command to stop the containers and free the resources associated with the emulation.

Finally, try editing the clos3.clab_vars.yml file and increase the number of leaf switches to 12 and the number of spine switches to 5 and repeat the tests with a more realistic topology. A big advantage of using containers to emulate network devices is that they are extremely lightweight, allowing realistic production networks to be emulated on a laptop. Try the other sflow-rt/containerlab examples to experiment with DDoS mitigation, EVPN monitoring, and flow tracing.

Thursday, December 1, 2022

IPv6 flow analytics with Containerlab

CONTAINERlab is a Docker orchestration tool for creating virtual network topologies. The sflow-rt/containerlab project contains a number of topologies demonstrating industry standard streaming sFlow telemetry with realistic data center topologies. This article extends the examples in Real-time telemetry from a 5 stage Clos fabric and Real-time EVPN fabric visibility to demonstrate visibility into IPv6 traffic flows.

docker run --rm -it --privileged --network host --pid="host" \
  -v /var/run/docker.sock:/var/run/docker.sock -v /run/netns:/run/netns \
  -v $(pwd):$(pwd) -w $(pwd) \
  ghcr.io/srl-labs/clab bash

Run the above command to start Containerlab if you already have Docker installed. Otherwise, Installation provides detailed instructions for a variety of platforms.

curl -O https://raw.githubusercontent.com/sflow-rt/containerlab/master/clos5.yml

Download the topology file for the 5 stage Clos fabric shown above.

containerlab deploy -t clos5.yml

Finally, deploy the topology.

The screen capture shows a real-time view of traffic flowing across the network during an iperf3 test. Click on the sFlow-RT Apps menu and select the browse-flows application, or click here for a direct link to a chart with the settings shown above.
docker exec -it clab-clos5-h1 iperf3 -c 2001:172:16:4::2

Each of the hosts in the network has an iperf3 server, so running the above command will test bandwidth between h1 and h4.

containerlab destroy -t clos5.yml

When you are finished, run the above command to stop the containers and free the resources associated with the emulation.

Real-time EVPN fabric visibility describes the EVPN configuration above in detail. The following steps extend the example to demonstrate visibility into IPv6 flows.
curl -O https://raw.githubusercontent.com/sflow-rt/containerlab/master/evpn3.yml
Download the topology file.
The screen capture shows a real-time view of traffic flowing across the network during an iperf3 test. Connect to the sFlow-RT Flow Browser application, or click here for a direct link to a chart with the settings shown above.
docker exec -it clab-evpn3-h1 iperf3 -c 2001:172:16:10::2

Each of the hosts in the network has an iperf3 server, so running the above command will test bandwidth between h1 and h2. The flow should immediately appear in the Flow Browser chart.

containerlab destroy -t evpn3.yml

When you are finished, run the above command to stop the containers and free the resources associated with the emulation.

The following articles describe additionial examples based on sflow-rt/containerlab topologies:

Moving the monitoring solution from Containerlab to production is straightforward since sFlow is widely implemented in datacenter equipment from vendors including: A10, Arista, Aruba, Cisco, Edge-Core, Extreme, Huawei, Juniper, NEC, Netgear, Nokia, NVIDIA, Quanta, and ZTE. In addition, the open source Host sFlow agent makes it easy to extend visibility beyond the physical network into the compute infrastructure.

Thursday, November 17, 2022

SC22 SCinet network monitoring

The data shown in the chart was gathered from The International Conference for High Performance Computing, Networking, Storage, and Analysis (SC22) being held this week in Dallas. The conference network, SCinet, is described as the fastest and most powerful network on Earth, connecting the SC community to the world. The chart provides an up to the second view of overall SCinet traffic, the lower chart showing total traffic hitting a sustained 8Tbps.
The poster shows the topology of the SCinet network. Monitoring flow data from 5,852 switch/router ports with 162Tbps total bandwith with sub-second latency is required to construct the charts.
The chart was generated using industry standard streaming sFlow telemetry from switches and routers in the SCinet network. An instance of the sFlow-RT real-time analytics engine computes the flow metrics shown in the charts.
Most of the load was due to large 400Gbit/s, 200Gbit/s and 100Gbit/s flows that were part of the Network Research Exhibition. The chart above shows that 10 large flows are responsible for 1.5Tbps of traffic.
Scientific network tags (scitags) describes how IPv6 flowlabels allow network flow analytics to identify network traffic associated with bulk scientific data transfers.
RDMA network visibility shows how bulk data transfers using Remote Direct Memory Access (RDMA).

Wednesday, November 16, 2022

RDMA network visibility

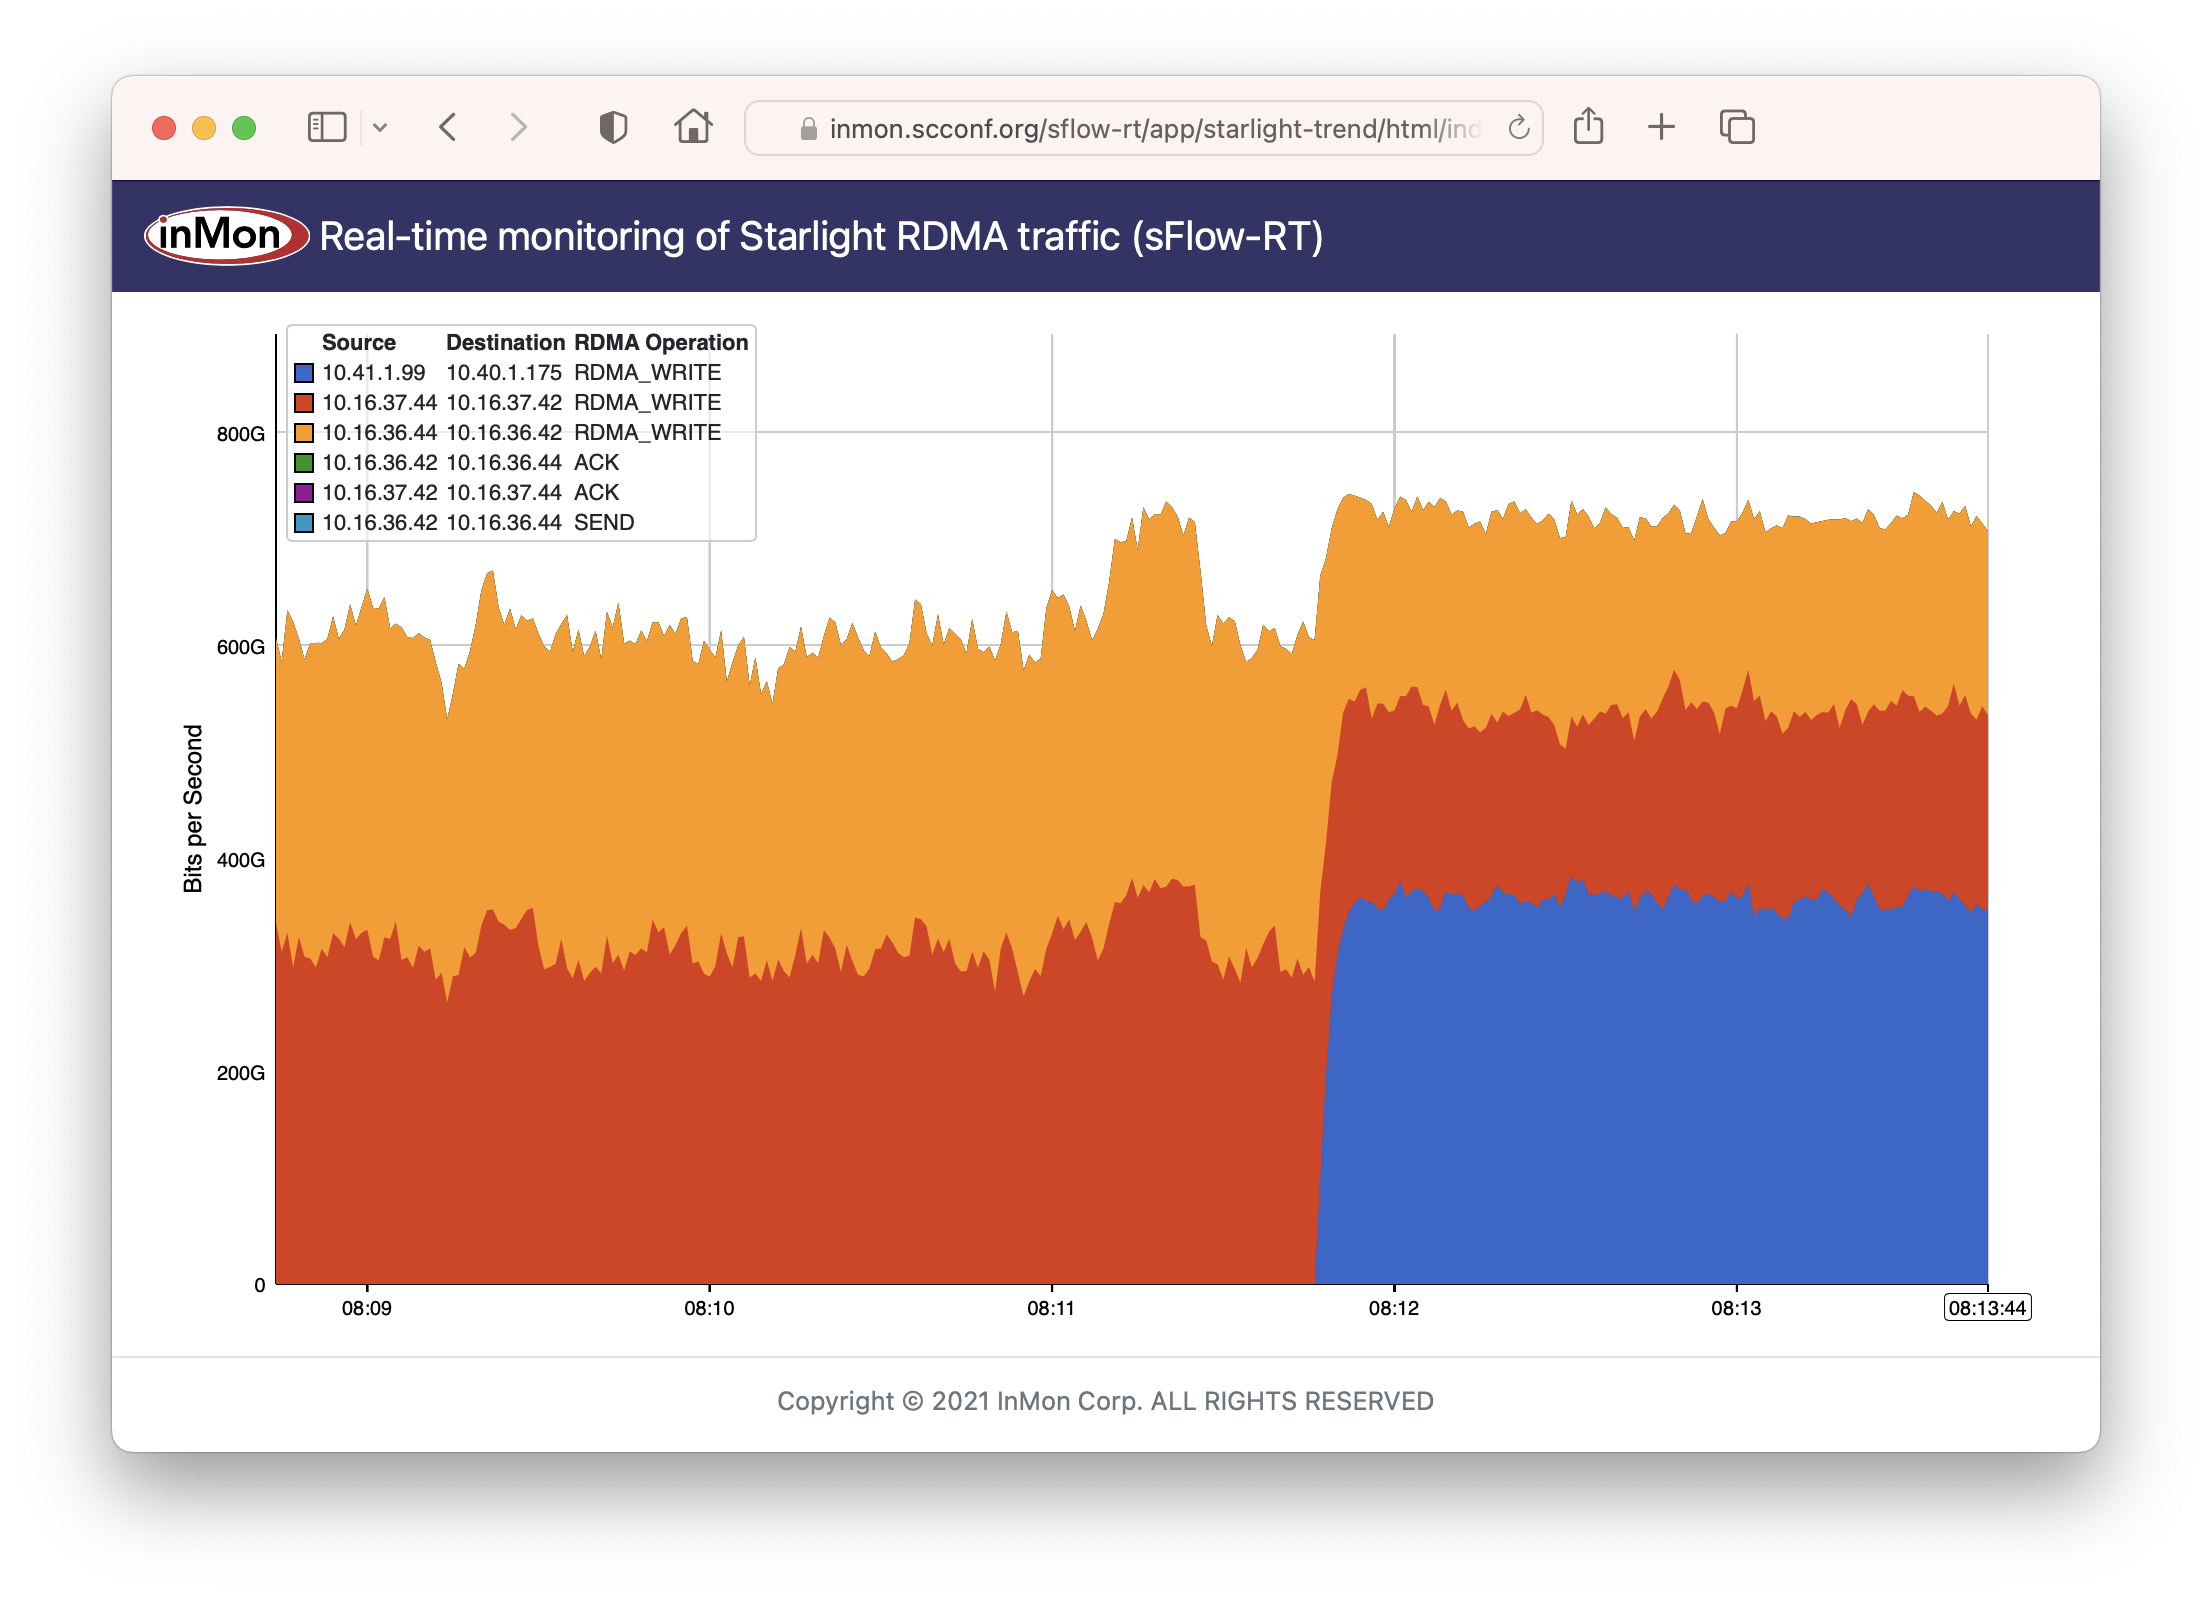
The Remote Direct Memory Access (RDMA) data shown in the chart was gathered from The International Conference for High Performance Computing, Networking, Storage, and Analysis (SC22) being held this week in Dallas. The conference network, SCinet, is described as the fastest and most powerful network on Earth, connecting the SC community to the world.
Resilient Distributed Processing and Reconfigurable Networks is one of the demonstrations using SCinet - Location: Booth 2847 (StarLight). Planned SC22 focus is on RDMA enabled data movement and dynamic network control.
  1. RDMA Tbps performance over global distance for timely Terabyte bulk data transfers (goal << 1 min Tbyte transfer on N by 400G network).
  2. Dynamic shifting of processing and network resources from on location/path/system to another (in response to demand and availability).
The real-time chart at the top of this page shows an up to the second view of RDMA traffic (broken out by source, destination, and RDMA operation).
The chart was generated using industry standard streaming sFlow telemetry from switches and routers in the SCinet network. An instance of the sFlow-RT analytics engine computes the RDMA flow metrics shown in the chart. RESTflow describes how sFlow disaggregates the traditional NetFlow / IPFIX analytics pipeline to offer flexible, scaleable, low latency flow measurements. Flow metrics with Prometheus and Grafana describes how metrics can be stored in a time series database for use in operational dashboards.

Real-time traffic analytics transforms network monitoring from reporting on the past to observing and acting on the present to automate troubleshooting and traffic engineering, e.g. Leaf and spine traffic engineering using segment routing and SDN and DDoS protection quickstart guide.