
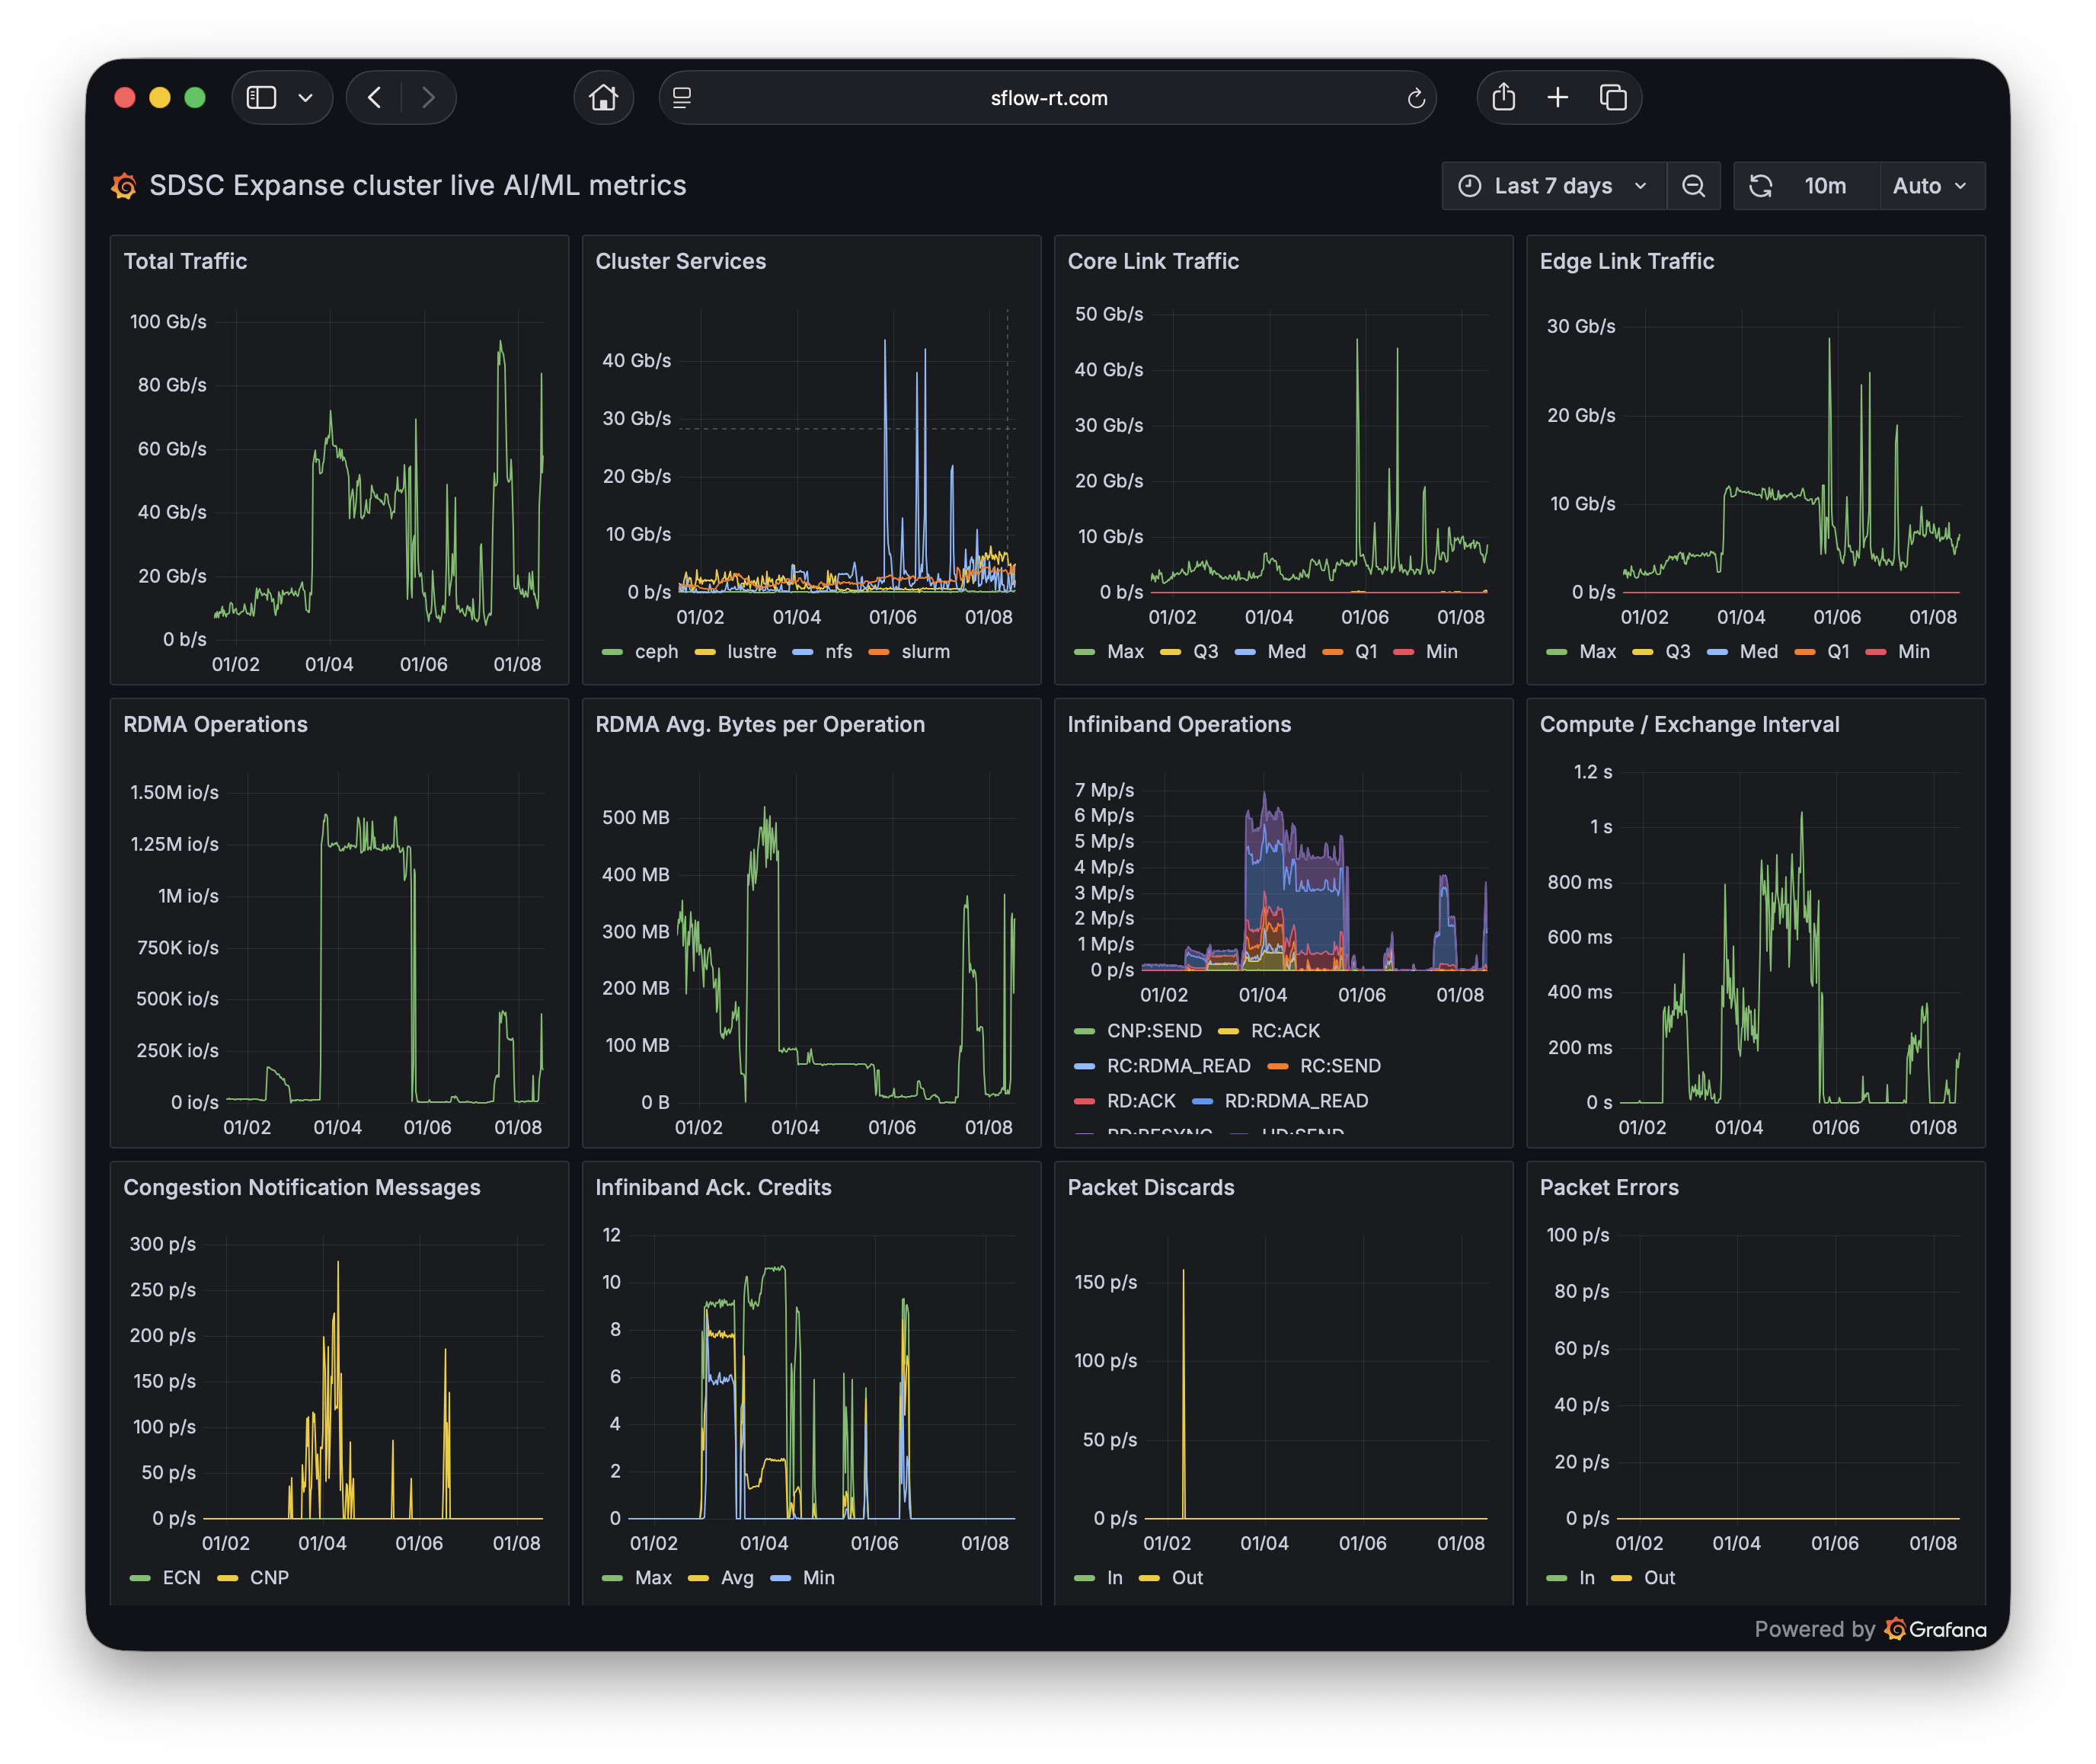
San Diego Supercomputer Center Expanse Cluster AI/ML dashboard using ai-metrics application. See AI Metrics with Prometheus and Grafana for detailed, step-by-step, instructions for setting up monitoring and dashboard.
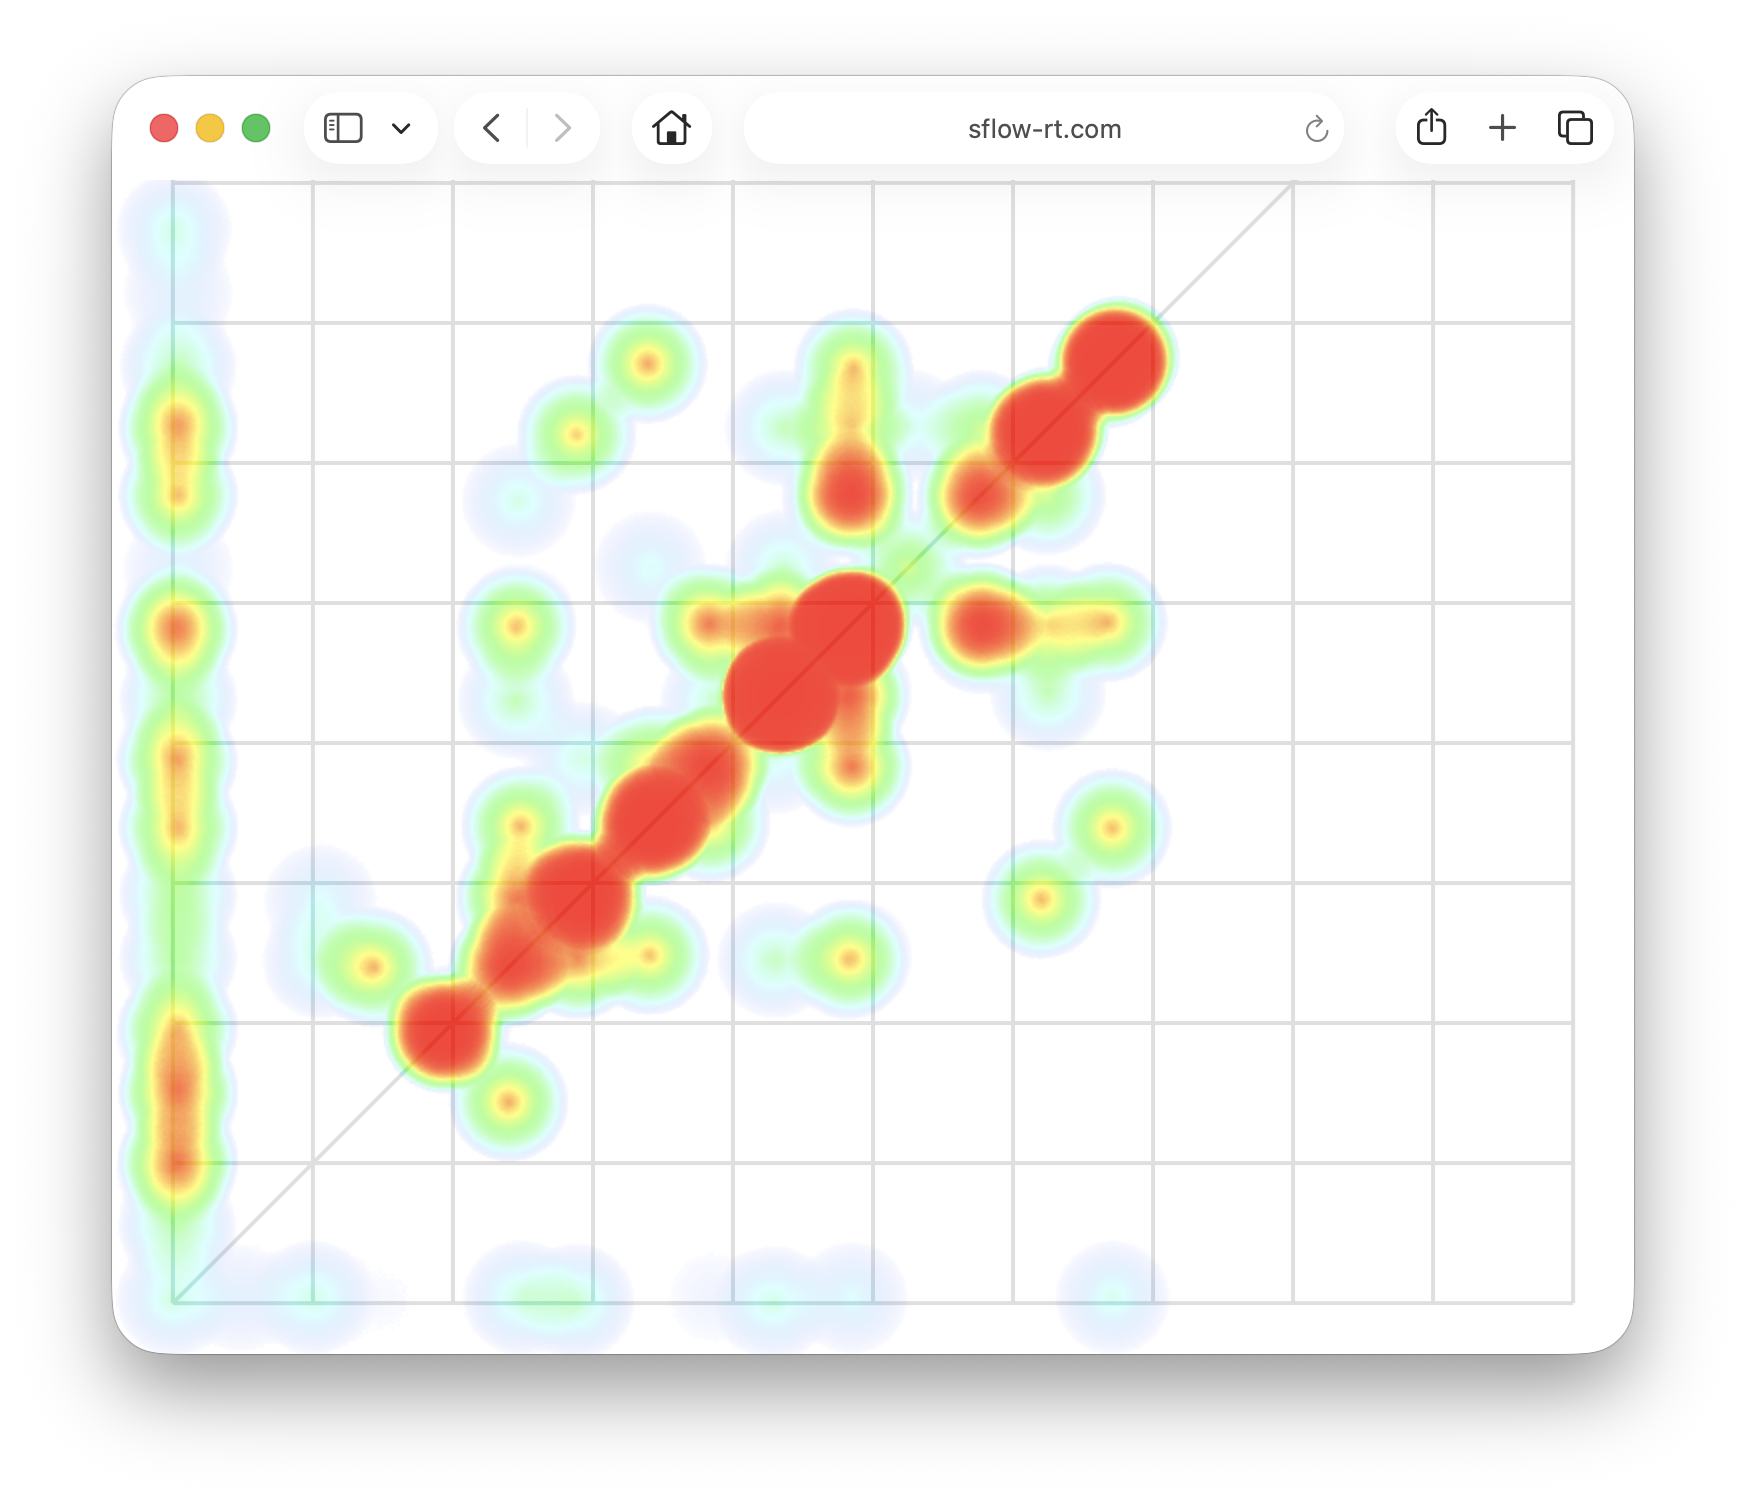
San Diego Supercomputer Center Expanse Cluster AI/ML traffic matrix using heatmap application. See Real-time visualization of AI / ML traffic matrix for an explanation of the chart with examples.
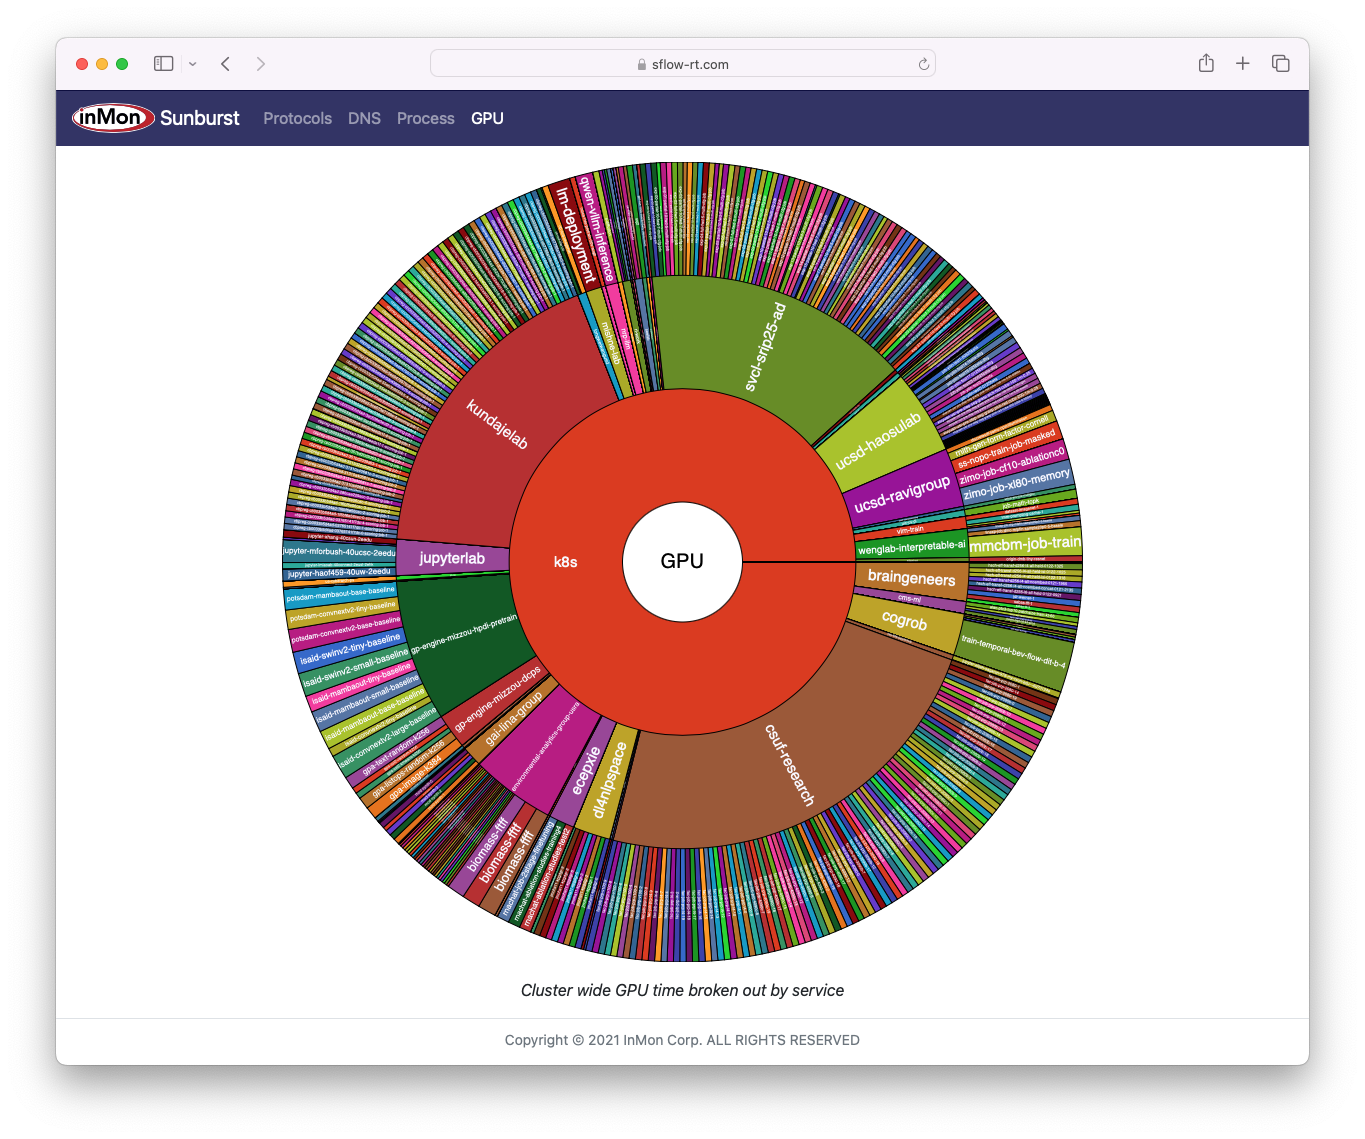
National Research Platform Nautilus Cluster GPU, CPU, and network resources in world-wide Kubernetes cluster using sunburst application. See Real-time Kubernetes cluster monitoring example for more details and step-by-step instructions for deploying monitoring.
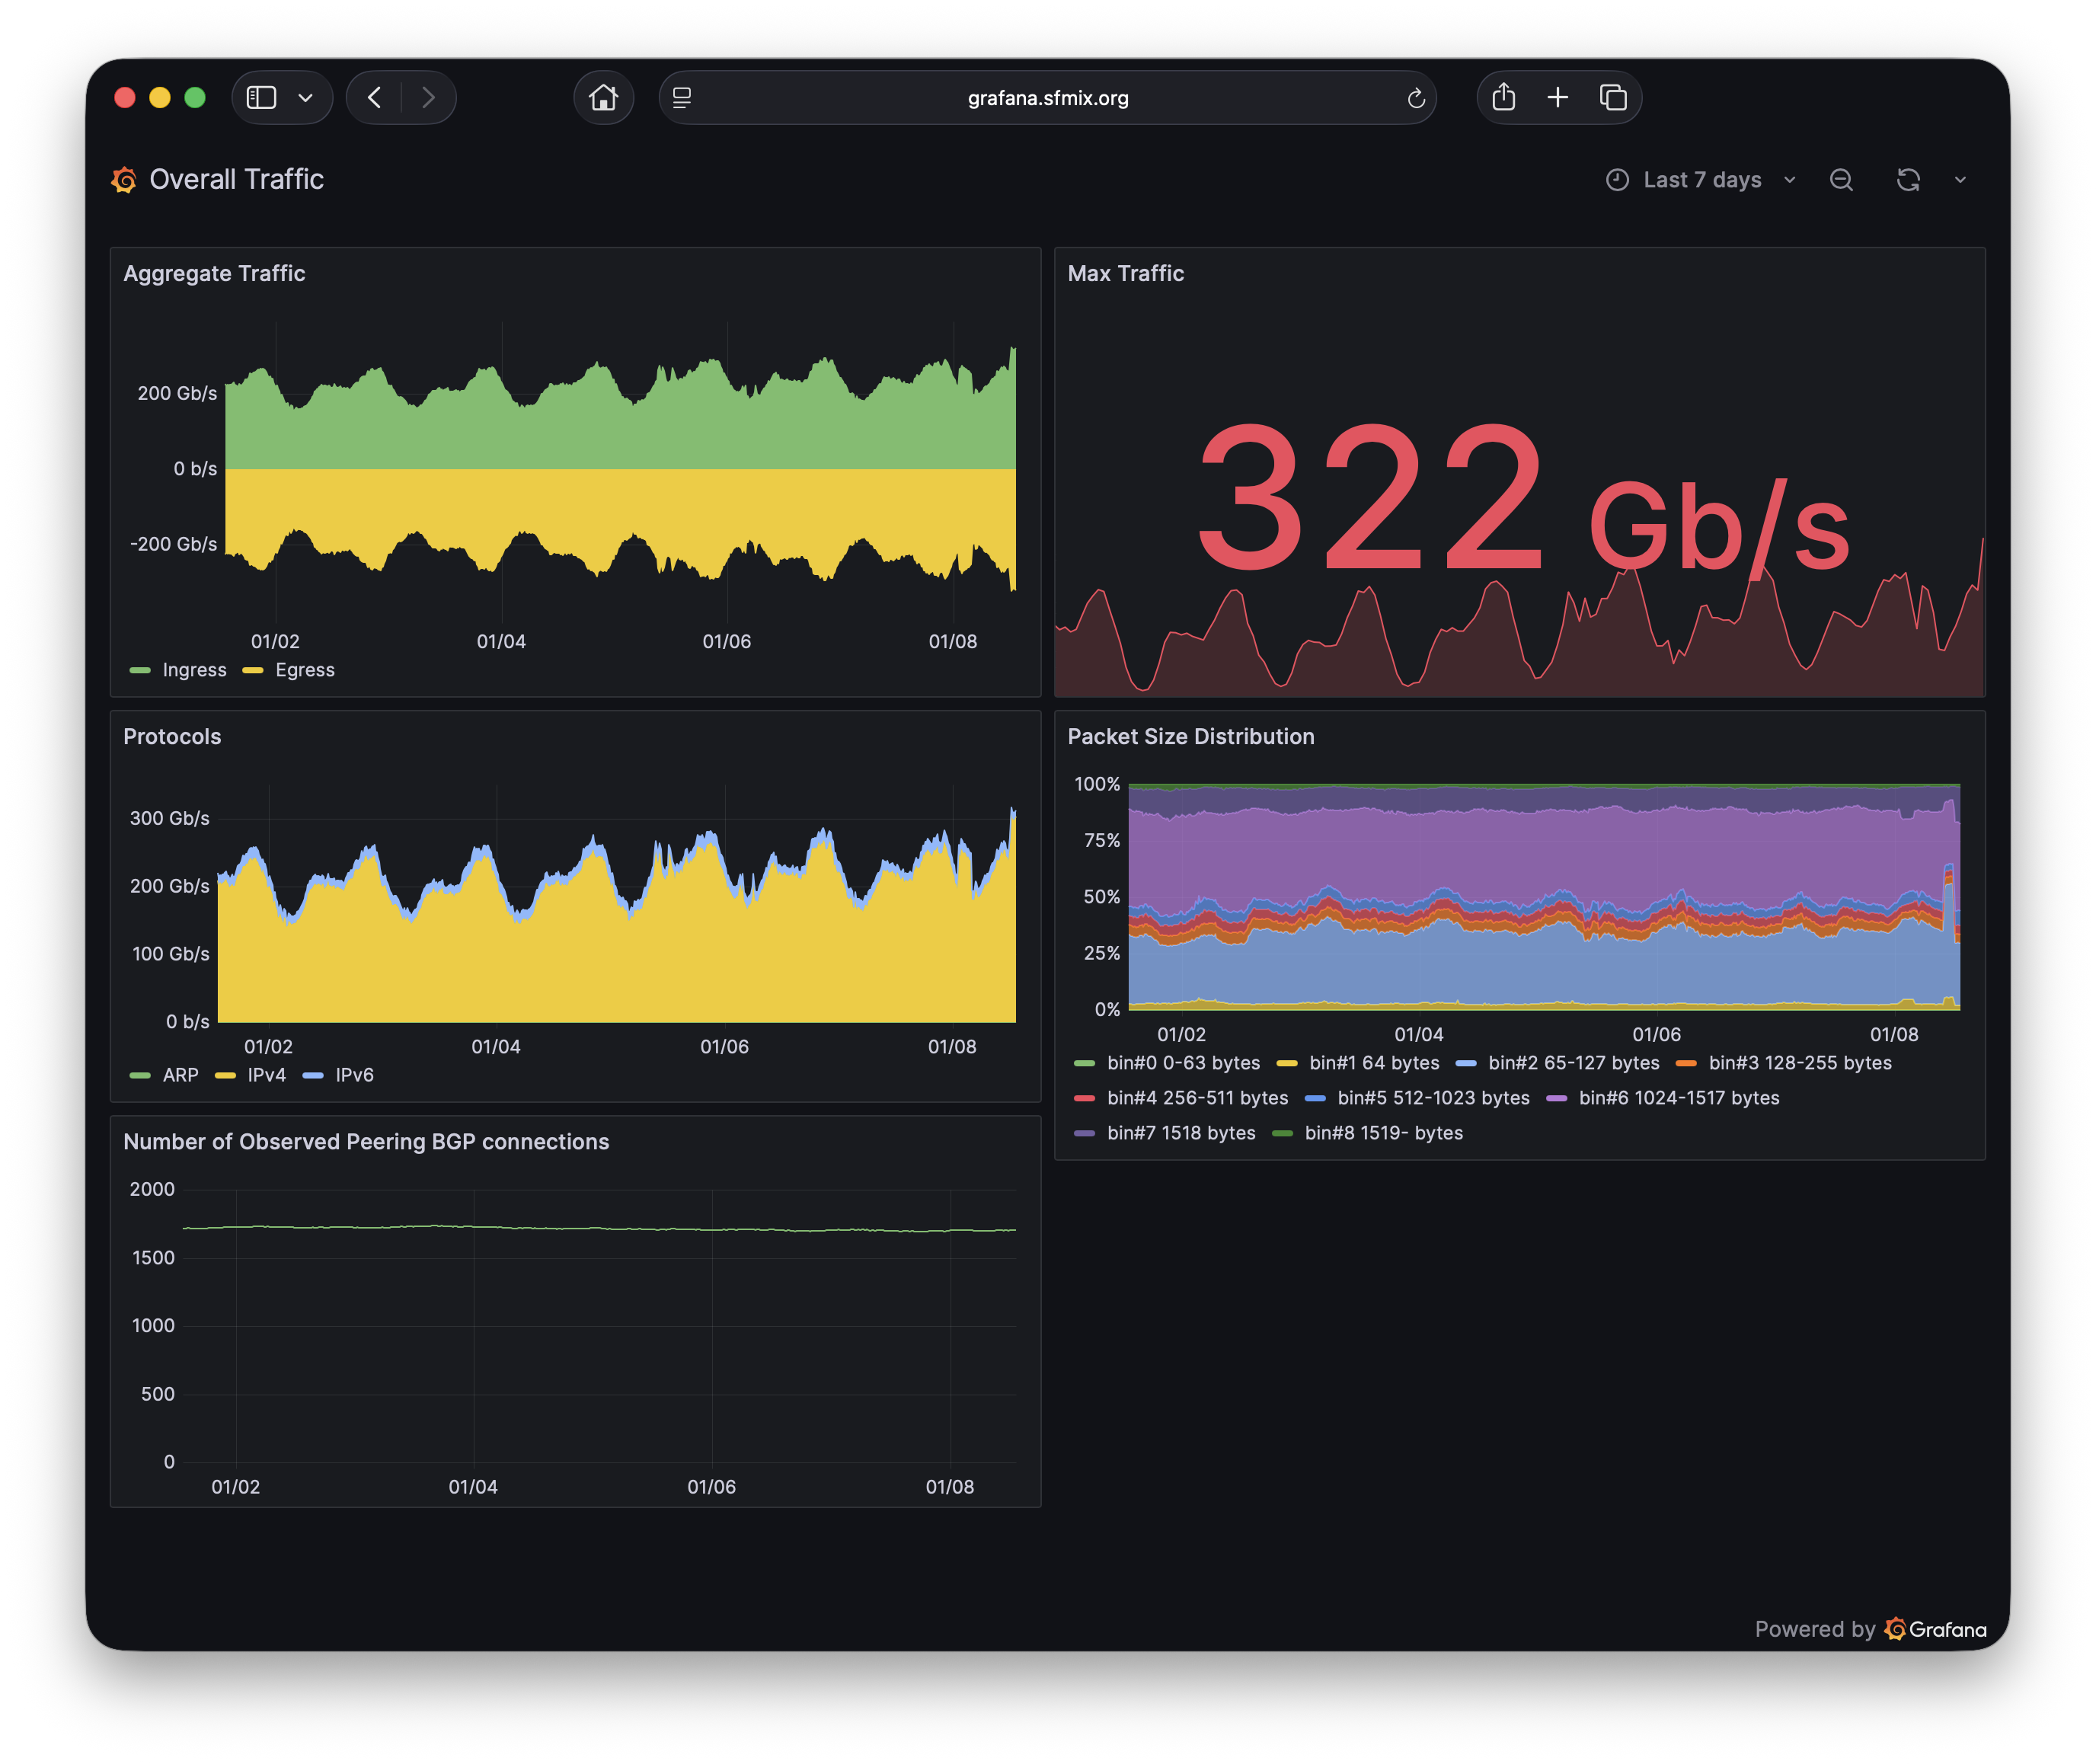
San Francisco Metropolitan Internet Exchange overall traffic dashboard using ixp-metrics application. See Internet eXchange Provider (IXP) Metrics for detailed, step-by-step, instructions for setting up overall exchange traffic and per member peering traffic dashboards.
Live Dashboards maintains a current list publicly accessible dashboards. If you have dashboard to share, would like help learning to build your own dashboards, or have a general interest in real-time flow analytics (DDoS mitigation, traffic engineering, etc), then you are welcome with the community of users and developers.
The Getting Started guide provides step by step instructions for setting up real-time traffic analytics. Even if you don't have immediate access to a network, Real-time network and system metrics as a service describes how to replay captured sFlow data to explore the capabilities of the software on your laptop. Alternatively, sflow-rt/containerlab includes projects that emulate leaf and spine networks, EVPN, and DDoS mitigation, that can be run on a laptop using Docker Desktop.
No comments:
Post a Comment